
Over the past six months, NetApp’s stock price fell to $102.35. Shareholders have lost 17.1% of their capital, disappointing when considering the S&P 500 was flat. This was partly driven by its softer quarterly results and may have investors wondering how to approach the situation.
Is there a buying opportunity in NetApp, or does it present a risk to your portfolio? Get the full stock story straight from our expert analysts, it’s free.
Why Is NetApp Not Exciting?
Even though the stock has become cheaper, we're cautious about NetApp. Here are three reasons why we avoid NTAP and a stock we'd rather own.
1. Long-Term Revenue Growth Disappoints
A company’s long-term sales performance is one signal of its overall quality. Any business can put up a good quarter or two, but many enduring ones grow for years. Unfortunately, NetApp’s 4% annualized revenue growth over the last five years was tepid. This fell short of our benchmark for the business services sector. 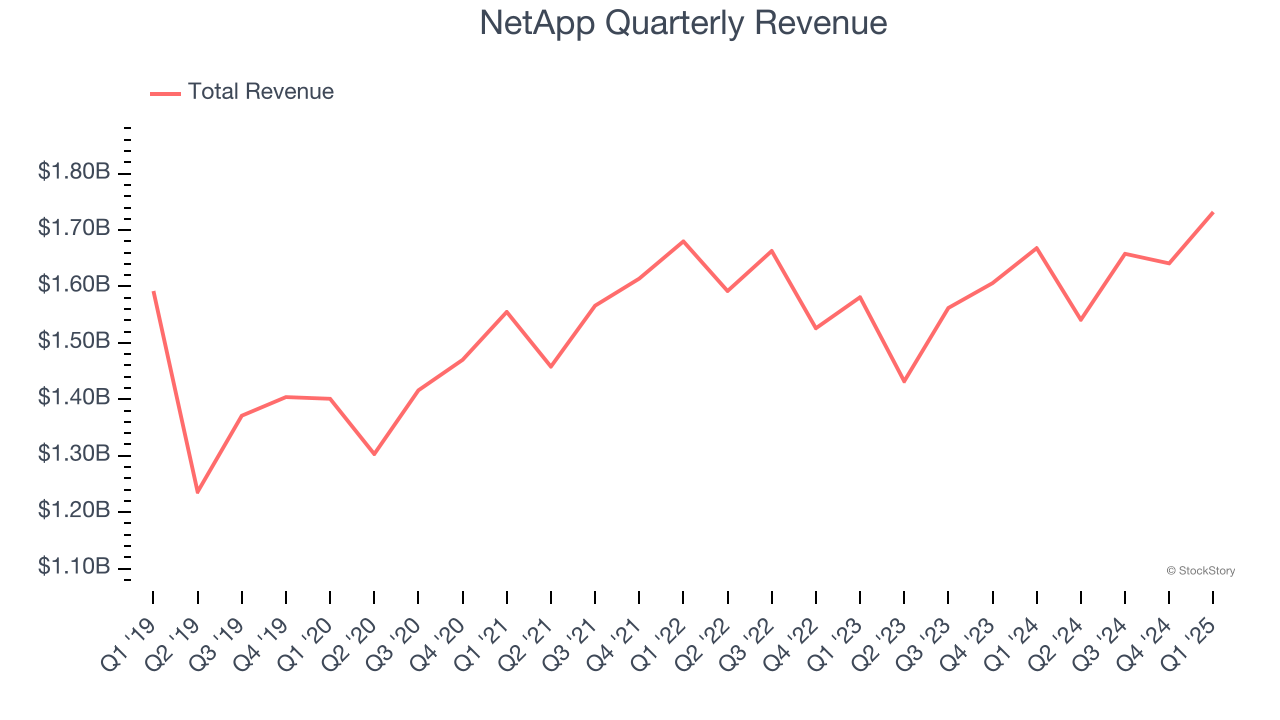
2. Weak Billings Growth Points to Soft Demand
Billings is a non-GAAP metric that sheds light on NetApp’s demand characteristics. This metric is often called “cash revenue” because it shows how much money the company has collected from customers in a certain period - different from reported revenue, which must be recognized in pieces over the length of a contract.
NetApp’s billings came in at $2.03 billion in the latest quarter, and over the last two years, its year-on-year growth averaged 3%. This performance was underwhelming and suggests it may need to improve its products, pricing, or go-to-market strategy. 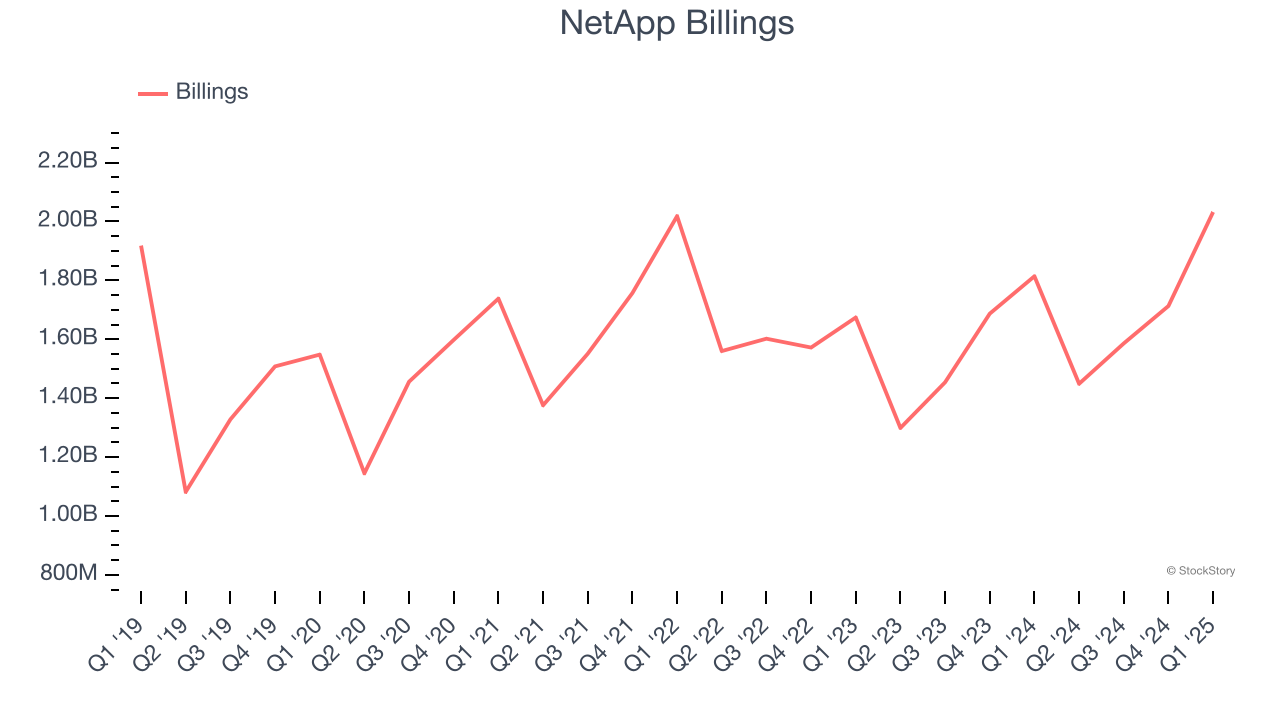
3. Projected Revenue Growth Is Slim
Forecasted revenues by Wall Street analysts signal a company’s potential. Predictions may not always be accurate, but accelerating growth typically boosts valuation multiples and stock prices while slowing growth does the opposite.
Over the next 12 months, sell-side analysts expect NetApp’s revenue to rise by 2.7%, close to its 4% annualized growth for the past five years. This projection is underwhelming and indicates its newer products and services will not accelerate its top-line performance yet.
Final Judgment
NetApp isn’t a terrible business, but it doesn’t pass our quality test. Following the recent decline, the stock trades at 13.3× forward P/E (or $102.35 per share). Beauty is in the eye of the beholder, but our analysis shows the upside isn’t great compared to the potential downside. We're pretty confident there are superior stocks to buy right now. Let us point you toward one of our all-time favorite software stocks.
Stocks We Like More Than NetApp
The market surged in 2024 and reached record highs after Donald Trump’s presidential victory in November, but questions about new economic policies are adding much uncertainty for 2025.
While the crowd speculates what might happen next, we’re homing in on the companies that can succeed regardless of the political or macroeconomic environment. Put yourself in the driver’s seat and build a durable portfolio by checking out our Top 5 Growth Stocks for this month. This is a curated list of our High Quality stocks that have generated a market-beating return of 183% over the last five years (as of March 31st 2025).
Stocks that made our list in 2020 include now familiar names such as Nvidia (+1,545% between March 2020 and March 2025) as well as under-the-radar businesses like the once-small-cap company Exlservice (+354% five-year return). Find your next big winner with StockStory today.