
Bloomin' Brands’s stock price has taken a beating over the past six months, shedding 32.3% of its value and falling to $8.43 per share. This was partly due to its softer quarterly results and may have investors wondering how to approach the situation.
Is there a buying opportunity in Bloomin' Brands, or does it present a risk to your portfolio? Dive into our full research report to see our analyst team’s opinion, it’s free.
Why Do We Think Bloomin' Brands Will Underperform?
Despite the more favorable entry price, we're swiping left on Bloomin' Brands for now. Here are three reasons why BLMN doesn't excite us and a stock we'd rather own.
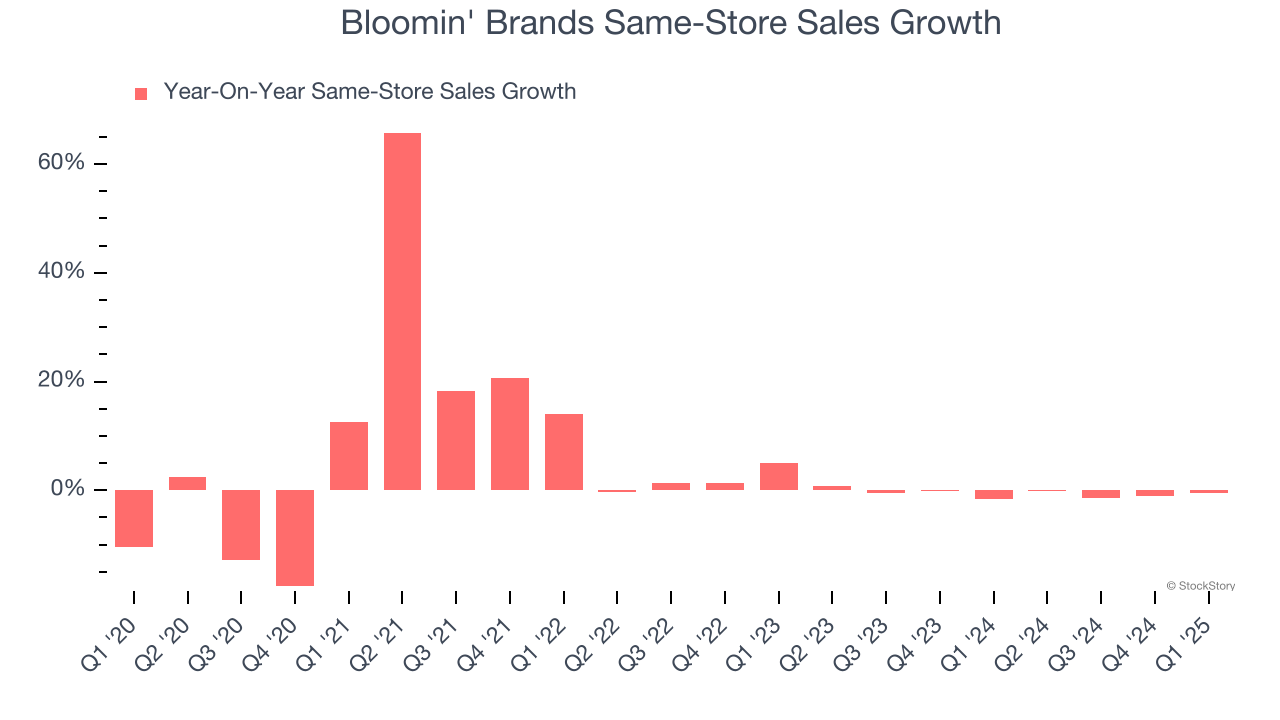
1. Flat Same-Store Sales Indicate Weak Demand
Same-store sales is a key performance indicator used to measure organic growth at restaurants open for at least a year.
Bloomin' Brands’s demand within its existing dining locations has barely increased over the last two years as its same-store sales were flat.
2. Revenue Projections Show Stormy Skies Ahead
Forecasted revenues by Wall Street analysts signal a company’s potential. Predictions may not always be accurate, but accelerating growth typically boosts valuation multiples and stock prices while slowing growth does the opposite.
Over the next 12 months, sell-side analysts expect Bloomin' Brands’s revenue to drop by 4.8%, a decrease from This projection is underwhelming and suggests its menu offerings will see some demand headwinds.
3. High Debt Levels Increase Risk
As long-term investors, the risk we care about most is the permanent loss of capital, which can happen when a company goes bankrupt or raises money from a disadvantaged position. This is separate from short-term stock price volatility, something we are much less bothered by.
Bloomin' Brands’s $2.10 billion of debt exceeds the $57.69 million of cash on its balance sheet. Furthermore, its 5× net-debt-to-EBITDA ratio (based on its EBITDA of $380.4 million over the last 12 months) shows the company is overleveraged.
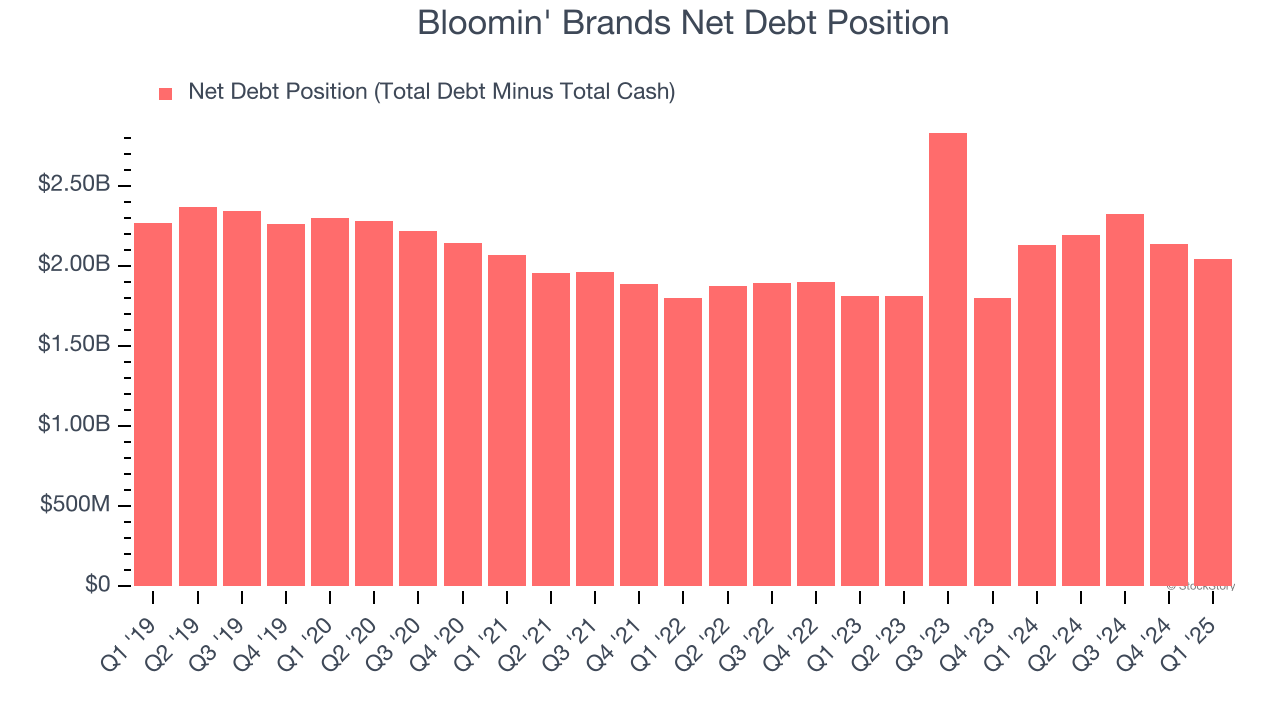
At this level of debt, incremental borrowing becomes increasingly expensive and credit agencies could downgrade the company’s rating if profitability falls. Bloomin' Brands could also be backed into a corner if the market turns unexpectedly – a situation we seek to avoid as investors in high-quality companies.
We hope Bloomin' Brands can improve its balance sheet and remain cautious until it increases its profitability or pays down its debt.
Final Judgment
Bloomin' Brands falls short of our quality standards. After the recent drawdown, the stock trades at 6.4× forward P/E (or $8.43 per share). While this valuation is optically cheap, the potential downside is huge given its shaky fundamentals. There are better investments elsewhere. We’d suggest looking at the most entrenched endpoint security platform on the market.
High-Quality Stocks for All Market Conditions
The market surged in 2024 and reached record highs after Donald Trump’s presidential victory in November, but questions about new economic policies are adding much uncertainty for 2025.
While the crowd speculates what might happen next, we’re homing in on the companies that can succeed regardless of the political or macroeconomic environment. Put yourself in the driver’s seat and build a durable portfolio by checking out our Top 9 Market-Beating Stocks. This is a curated list of our High Quality stocks that have generated a market-beating return of 183% over the last five years (as of March 31st 2025).
Stocks that made our list in 2020 include now familiar names such as Nvidia (+1,545% between March 2020 and March 2025) as well as under-the-radar businesses like the once-small-cap company Comfort Systems (+782% five-year return). Find your next big winner with StockStory today.


