
Luxury furniture retailer RH (NYSE: RH) fell short of the market’s revenue expectations in Q1 CY2025, but sales rose 12% year on year to $814 million. Next quarter’s revenue guidance of $904.3 million underwhelmed, coming in 0.7% below analysts’ estimates. Its non-GAAP profit of $0.13 per share was significantly above analysts’ consensus estimates.
Is now the time to buy RH? Find out by accessing our full research report, it’s free.
RH (RH) Q1 CY2025 Highlights:
- Revenue: $814 million vs analyst estimates of $819 million (12% year-on-year growth, 0.6% miss)
- Adjusted EPS: $0.13 vs analyst estimates of -$0.07 (significant beat)
- Adjusted EBITDA: $106.4 million vs analyst estimates of $104.4 million (13.1% margin, 2% beat)
- Revenue Guidance for Q2 CY2025 is $904.3 million at the midpoint, below analyst estimates of $910.9 million
- Operating Margin: 6.9%, in line with the same quarter last year
- Free Cash Flow was $34.08 million, up from -$10.13 million in the same quarter last year
- Market Capitalization: $3.35 billion
Company Overview
Formerly known as Restoration Hardware, RH (NYSE: RH) is a specialty retailer that exclusively sells its own brand of high-end furniture and home decor.
Sales Growth
Examining a company’s long-term performance can provide clues about its quality. Any business can put up a good quarter or two, but many enduring ones grow for years.
With $3.27 billion in revenue over the past 12 months, RH is a small retailer, which sometimes brings disadvantages compared to larger competitors benefiting from economies of scale and negotiating leverage with suppliers.
As you can see below, RH grew its sales at a sluggish 4.2% compounded annual growth rate over the last six years (we compare to 2019 to normalize for COVID-19 impacts).
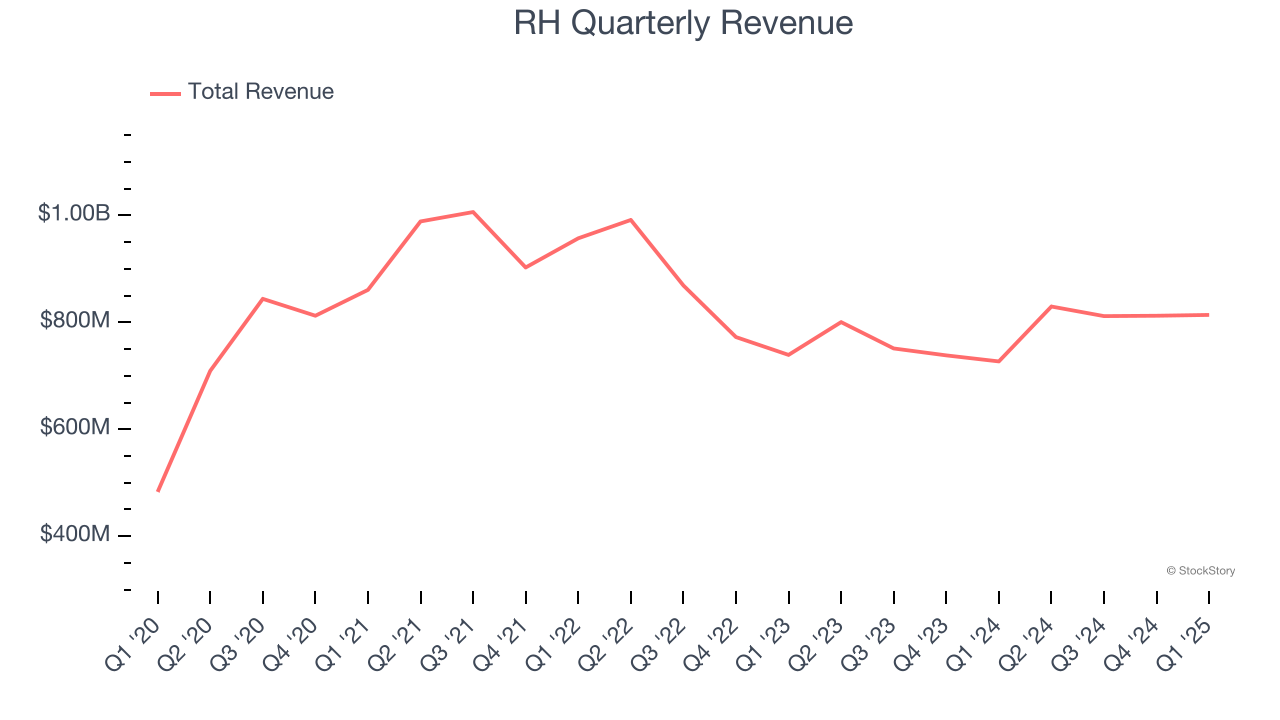
This quarter, RH’s revenue grew by 12% year on year to $814 million but fell short of Wall Street’s estimates. Company management is currently guiding for a 9% year-on-year increase in sales next quarter.
Looking further ahead, sell-side analysts expect revenue to grow 10.2% over the next 12 months, an acceleration versus the last six years. This projection is eye-popping and indicates its newer products will spur better top-line performance.
Unless you’ve been living under a rock, it should be obvious by now that generative AI is going to have a huge impact on how large corporations do business. While Nvidia and AMD are trading close to all-time highs, we prefer a lesser-known (but still profitable) stock benefiting from the rise of AI. Click here to access our free report one of our favorites growth stories.
Store Performance
Number of Stores
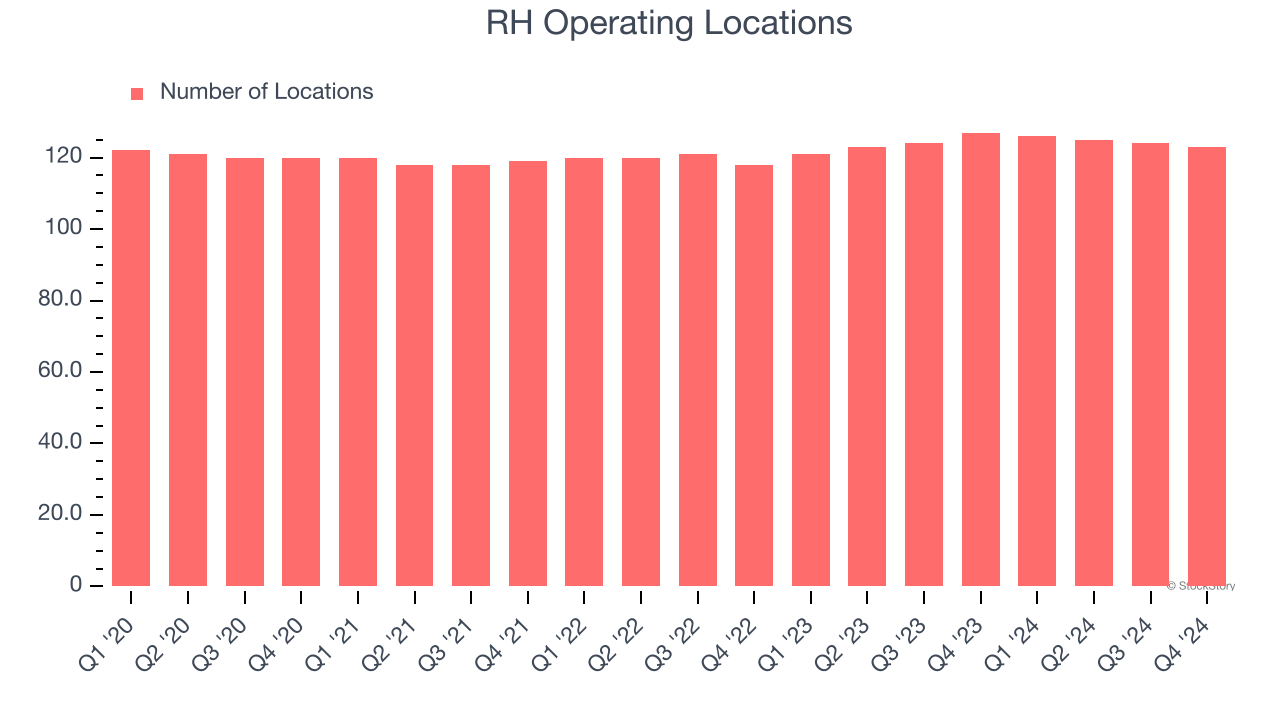
Over the last two years, RH opened new stores quickly, averaging 2.2% annual growth. This was faster than the broader consumer retail sector.
When a retailer opens new stores, it usually means it’s investing for growth because demand is greater than supply, especially in areas where consumers may not have a store within reasonable driving distance.
Note that RH reports its store count intermittently, so some data points are missing in the chart below.
Same-Store Sales
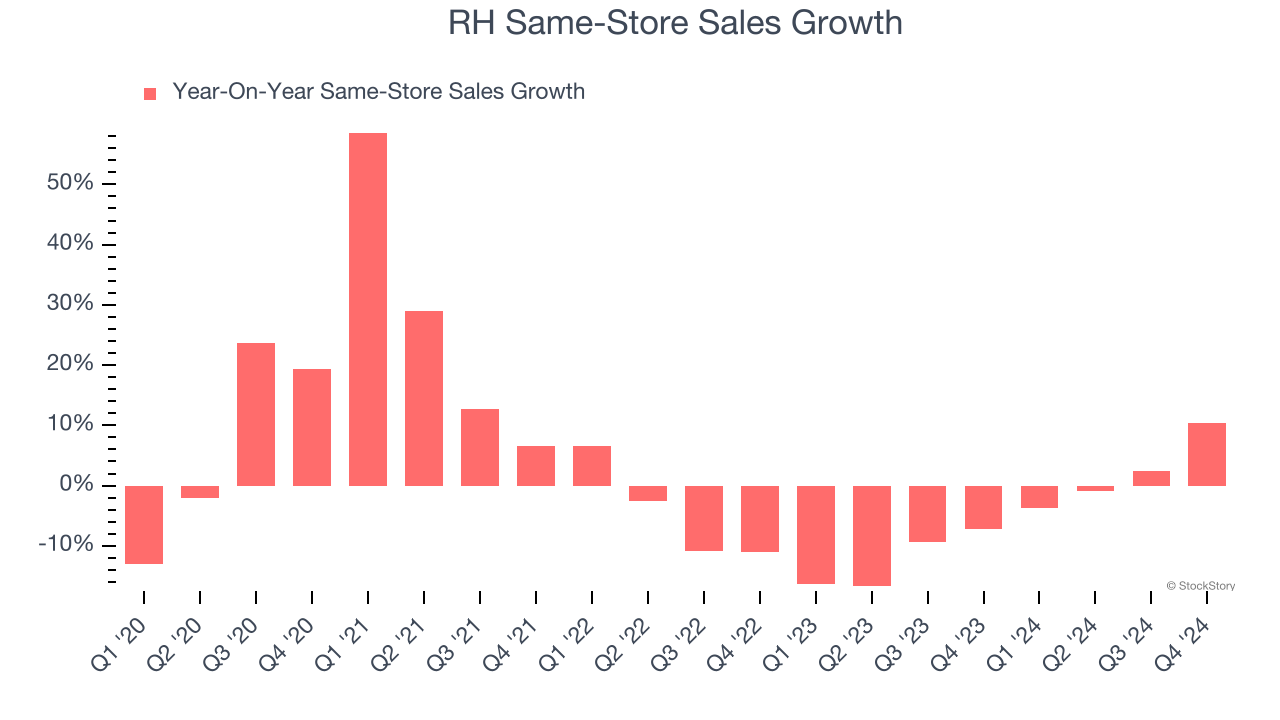
A company's store base only paints one part of the picture. When demand is high, it makes sense to open more. But when demand is low, it’s prudent to close some locations and use the money in other ways. Same-store sales gives us insight into this topic because it measures organic growth for a retailer's e-commerce platform and brick-and-mortar shops that have existed for at least a year.
RH’s demand has been shrinking over the last two years as its same-store sales have averaged 3.6% annual declines. This performance is concerning - it shows RH artificially boosts its revenue by building new stores. We’d like to see a company’s same-store sales rise before it takes on the costly, capital-intensive endeavor of expanding its store base.
Note that RH reports its same-store sales intermittently, so some data points are missing in the chart below.
Key Takeaways from RH’s Q1 Results
We were impressed by how significantly RH blew past analysts’ EPS expectations this quarter. We were also happy its EBITDA outperformed Wall Street’s estimates. On the other hand, its revenue fell short. Overall, this print was mixed but still had some key positives. The stock traded up 19.2% to $211 immediately following the results.
Sure, RH had a solid quarter, but if we look at the bigger picture, is this stock a buy? When making that decision, it’s important to consider its valuation, business qualities, as well as what has happened in the latest quarter. We cover that in our actionable full research report which you can read here, it’s free.


