
Earnings results often indicate what direction a company will take in the months ahead. With Q1 behind us, let’s have a look at Champion Homes (NYSE: SKY) and its peers.
Traditionally, homebuilders have built competitive advantages with economies of scale that lead to advantaged purchasing and brand recognition among consumers. Aesthetic trends have always been important in the space, but more recently, energy efficiency and conservation are driving innovation. However, these companies are still at the whim of the macro, specifically interest rates that heavily impact new and existing home sales. In fact, homebuilders are one of the most cyclical subsectors within industrials.
The 12 home builders stocks we track reported a slower Q1. As a group, revenues beat analysts’ consensus estimates by 0.8%.
While some home builders stocks have fared somewhat better than others, they have collectively declined. On average, share prices are down 3% since the latest earnings results.
Champion Homes (NYSE: SKY)
Founded in 1951, Champion Homes (NYSE: SKY) is a manufacturer of modular homes and buildings in North America.
Champion Homes reported revenues of $593.9 million, up 10.7% year on year. This print fell short of analysts’ expectations by 1.2%. Overall, it was a disappointing quarter for the company with a significant miss of analysts’ adjusted operating income estimates.

The stock is down 22.5% since reporting and currently trades at $65.22.
Read our full report on Champion Homes here, it’s free.
Best Q1: Toll Brothers (NYSE: TOL)
Started by two brothers who started by building and selling just one home in Pennsylvania, today Toll Brothers (NYSE: TOL) is a luxury homebuilder across the United States.
Toll Brothers reported revenues of $2.74 billion, down 3.5% year on year, outperforming analysts’ expectations by 9.9%. The business had an incredible quarter with an impressive beat of analysts’ EBITDA estimates and a solid beat of analysts’ EPS estimates.
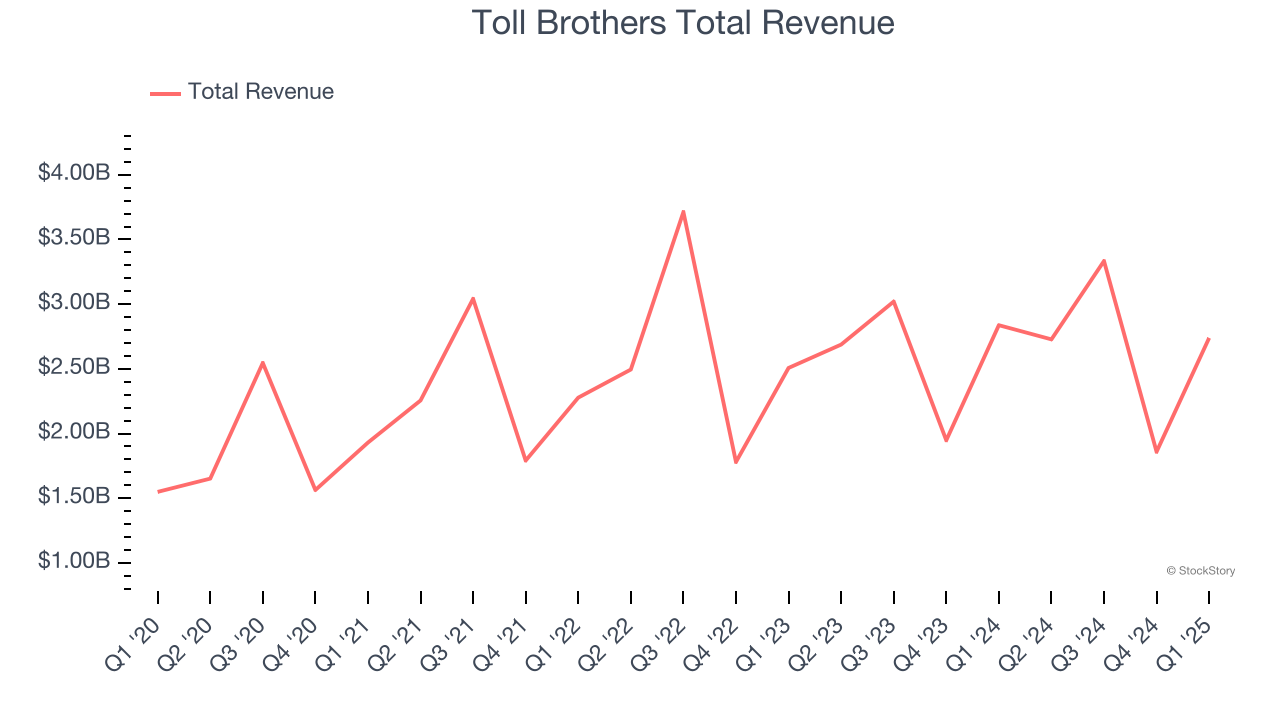
Toll Brothers pulled off the biggest analyst estimates beat among its peers. The market seems content with the results as the stock is up 4.9% since reporting. It currently trades at $109.55.
Is now the time to buy Toll Brothers? Access our full analysis of the earnings results here, it’s free.
Weakest Q1: KB Home (NYSE: KBH)
The first homebuilder to be listed on the NYSE, KB Home (NYSE: KB) is a homebuilding company targeting the first-time home buyer and move-up buyer markets.
KB Home reported revenues of $1.39 billion, down 5.2% year on year, falling short of analysts’ expectations by 6.5%. It was a disappointing quarter as it posted full-year revenue guidance missing analysts’ expectations.
KB Home delivered the weakest performance against analyst estimates in the group. As expected, the stock is down 12.9% since the results and currently trades at $53.81.
Read our full analysis of KB Home’s results here.
Taylor Morrison Home (NYSE: TMHC)
Named “America’s Most Trusted Home Builder” in 2019, Taylor Morrison Home (NYSE: TMHC) builds single family homes and communities across the United States.
Taylor Morrison Home reported revenues of $1.90 billion, up 11.5% year on year. This print surpassed analysts’ expectations by 5.7%. Overall, it was a strong quarter as it also produced a solid beat of analysts’ EBITDA estimates.
Taylor Morrison Home scored the fastest revenue growth among its peers. The stock is flat since reporting and currently trades at $58.73.
Read our full, actionable report on Taylor Morrison Home here, it’s free.
Tri Pointe Homes (NYSE: TPH)
Established in 2009 in California, Tri Pointe Homes (NYSE: TPH) is a United States homebuilder recognized for its innovative and sustainable approach to creating premium, life-enhancing homes.
Tri Pointe Homes reported revenues of $740.9 million, down 21.1% year on year. This result beat analysts’ expectations by 4%. It was a strong quarter as it also put up an impressive beat of analysts’ EPS estimates and a solid beat of analysts’ EBITDA estimates.
Tri Pointe Homes had the slowest revenue growth among its peers. The stock is flat since reporting and currently trades at $31.10.
Read our full, actionable report on Tri Pointe Homes here, it’s free.
Market Update
In response to the Fed’s rate hikes in 2022 and 2023, inflation has been gradually trending down from its post-pandemic peak, trending closer to the Fed’s 2% target. Despite higher borrowing costs, the economy has avoided flashing recessionary signals. This is the much-desired soft landing that many investors hoped for. The recent rate cuts (0.5% in September and 0.25% in November 2024) have bolstered the stock market, making 2024 a strong year for equities. Donald Trump’s presidential win in November sparked additional market gains, sending indices to record highs in the days following his victory. However, debates continue over possible tariffs and corporate tax adjustments, raising questions about economic stability in 2025.
Want to invest in winners with rock-solid fundamentals? Check out our Top 5 Growth Stocks and add them to your watchlist. These companies are poised for growth regardless of the political or macroeconomic climate.


