
Over the last six months, Trustmark’s shares have sunk to $34.60, producing a disappointing 7.8% loss while the S&P 500 was flat. This might have investors contemplating their next move.
Following the pullback, is this a buying opportunity for TRMK? Find out in our full research report, it’s free.
Why Does Trustmark Spark Debate?
Tracing its roots back to 1889 in Mississippi, Trustmark (NASDAQ: TRMK) is a financial services organization providing banking, wealth management, insurance, and mortgage services across five southeastern states.
Two Positive Attributes:
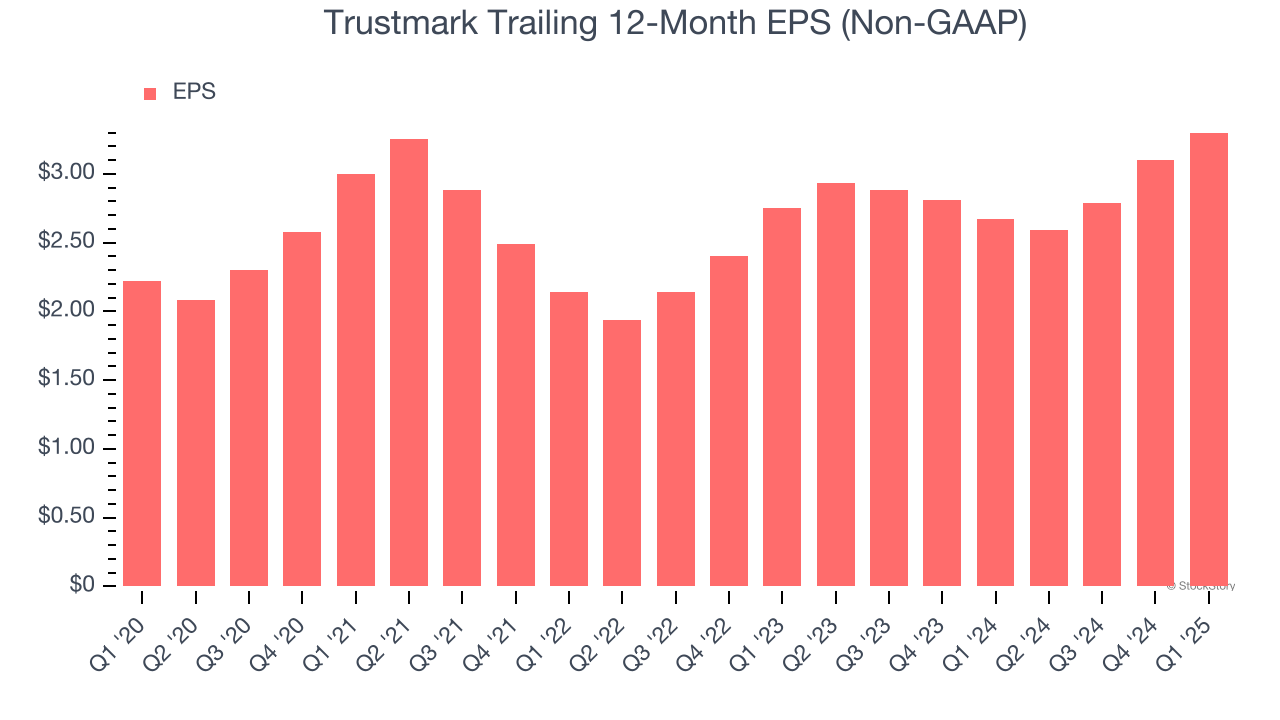
1. Outstanding Long-Term EPS Growth
Analyzing the long-term change in earnings per share (EPS) shows whether a company's incremental sales were profitable – for example, revenue could be inflated through excessive spending on advertising and promotions.
Trustmark’s EPS grew at a remarkable 8.3% compounded annual growth rate over the last five years, higher than its 1.7% annualized revenue declines. This tells us management adapted its cost structure in response to a challenging demand environment.
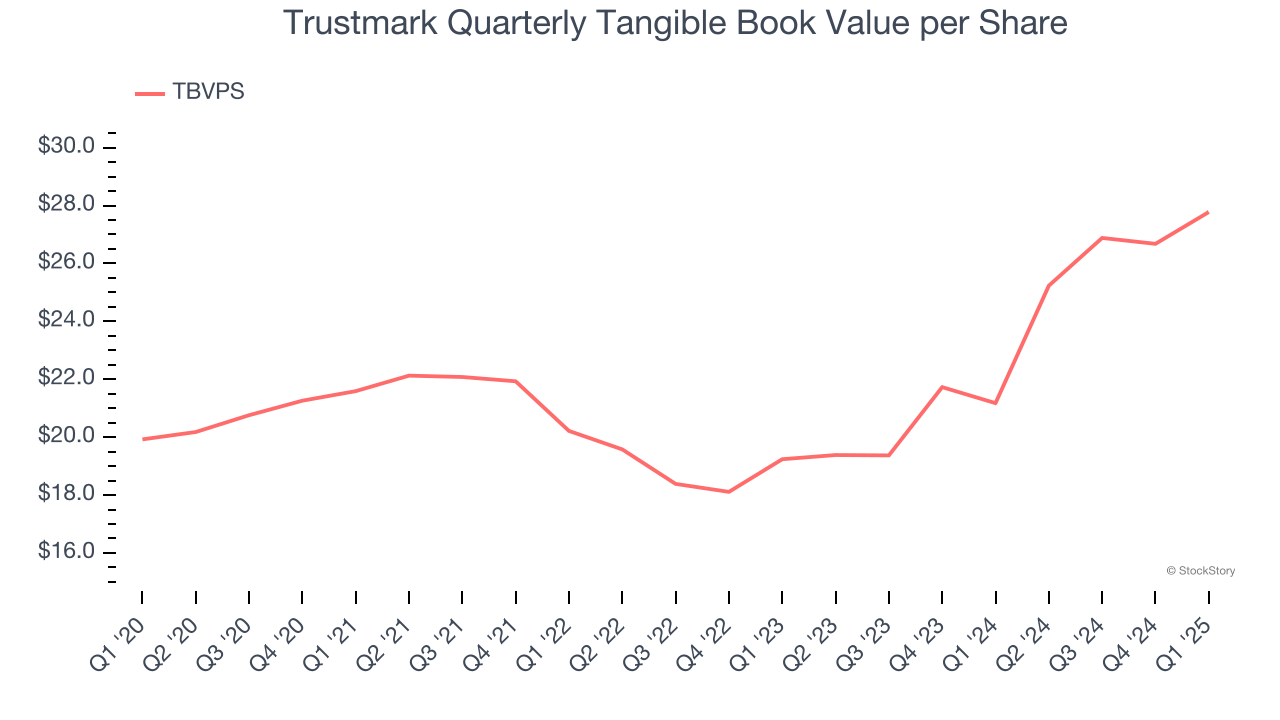
2. Growing TBVPS Reflects Strong Asset Base
We consider tangible book value per share (TBVPS) the most important metric to track for banks. TBVPS represents the real, liquid net worth per share of a bank, excluding intangible assets that have debatable value upon liquidation.
Trustmark’s TBVPS increased by 6.9% annually over the last five years, and growth has recently accelerated as TBVPS grew at an incredible 20.2% annual clip over the past two years (from $19.24 to $27.78 per share).
One Reason to be Careful:
Revenue Spiraling Downwards
From lending activities to service fees, most banks build their revenue model around two income sources. Interest rate spreads between loans and deposits create the first stream, with the second coming from charges on everything from basic bank accounts to complex investment banking transactions.
Trustmark struggled to consistently generate demand over the last five years as its revenue dropped at a 1.7% annual rate. This wasn’t a great result, but there are still things to like about Trustmark. 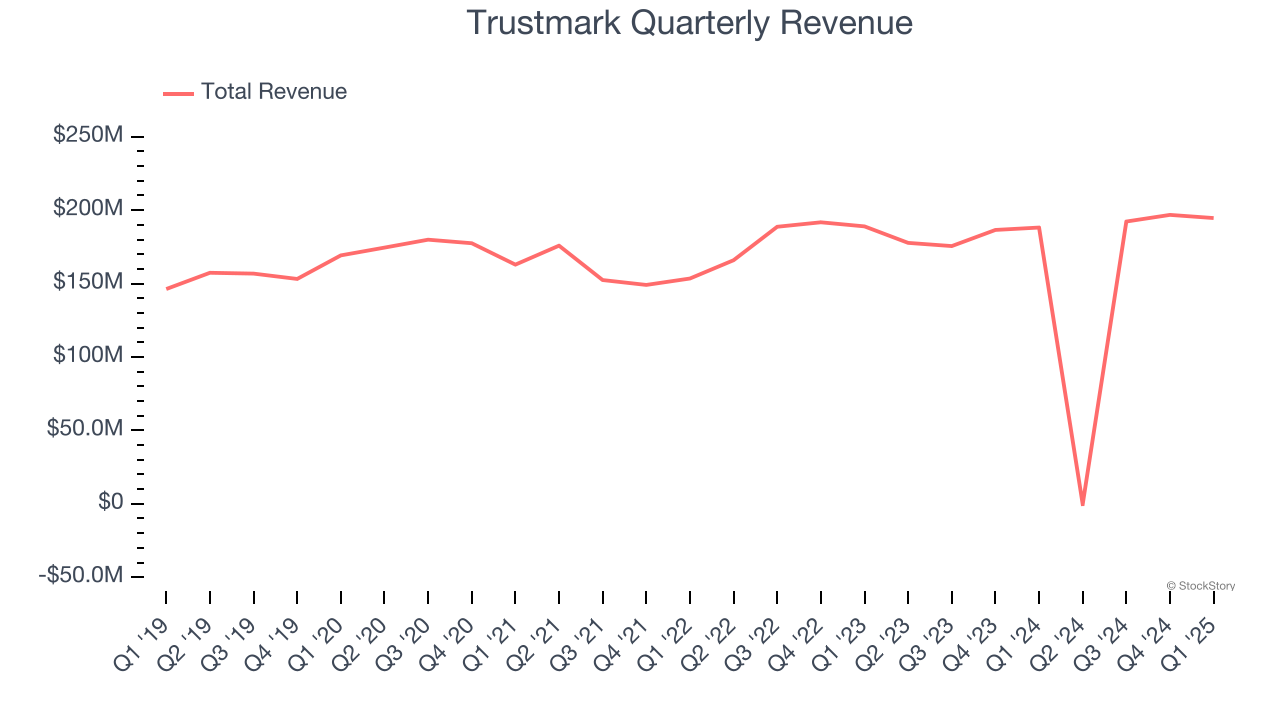
Final Judgment
Trustmark has huge potential even though it has some open questions. With the recent decline, the stock trades at 1× forward P/B (or $34.60 per share). Is now a good time to buy? See for yourself in our full research report, it’s free.
Stocks We Like Even More Than Trustmark
Donald Trump’s victory in the 2024 U.S. Presidential Election sent major indices to all-time highs, but stocks have retraced as investors debate the health of the economy and the potential impact of tariffs.
While this leaves much uncertainty around 2025, a few companies are poised for long-term gains regardless of the political or macroeconomic climate, like our Top 5 Strong Momentum Stocks for this week. This is a curated list of our High Quality stocks that have generated a market-beating return of 183% over the last five years (as of March 31st 2025).
Stocks that made our list in 2020 include now familiar names such as Nvidia (+1,545% between March 2020 and March 2025) as well as under-the-radar businesses like the once-micro-cap company Kadant (+351% five-year return). Find your next big winner with StockStory today.