Since December 2024, Cadence has been in a holding pattern, posting a small loss of 1.3% while floating around $297.30.
Given the underwhelming price action, is now a good time to buy CDNS? Or should investors expect a bumpy road ahead? Find out in our full research report, it’s free.
Why Does CDNS Stock Spark Debate?
With the name chosen to reflect the idea of a repeating pattern or rhythm in electronic design, Cadence Design Systems (NASDAQ: CDNS) offers a software-as-a-service platform for semiconductor engineering and design.
Two Positive Attributes:
1. Billings Surge, Boosting Cash On Hand
Billings is a non-GAAP metric that is often called “cash revenue” because it shows how much money the company has collected from customers in a certain period. This is different from revenue, which must be recognized in pieces over the length of a contract.
Cadence’s billings punched in at $1.23 billion in Q1, and over the last four quarters, its year-on-year growth averaged 24%. This performance was impressive, indicating robust customer demand. The high level of cash collected from customers also enhances liquidity and provides a solid foundation for future investments and growth. 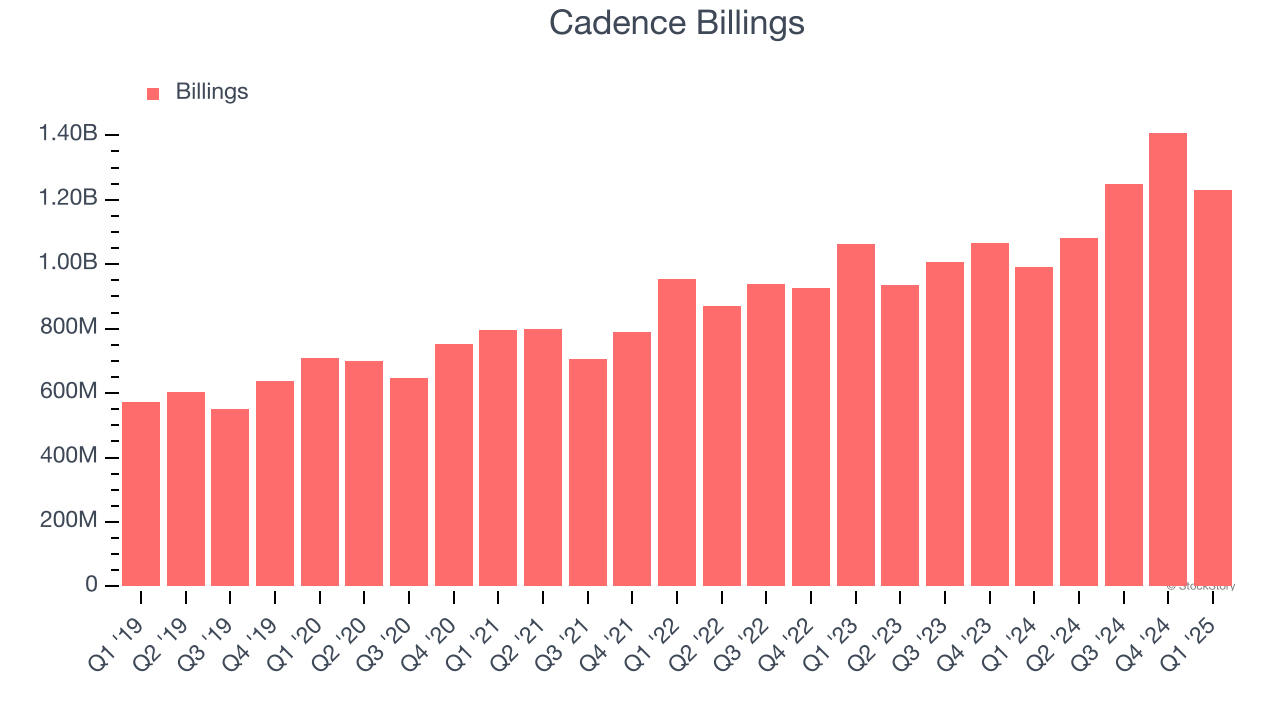
2. Customer Acquisition Costs Are Recovered in Record Time
The customer acquisition cost (CAC) payback period represents the months required to recover the cost of acquiring a new customer. Essentially, it’s the break-even point for sales and marketing investments. A shorter CAC payback period is ideal, as it implies better returns on investment and business scalability.
Cadence is extremely efficient at acquiring new customers, and its CAC payback period checked in at 3.7 months this quarter. The company’s rapid recovery of its customer acquisition costs indicates it has a highly differentiated product offering and a strong brand reputation. These dynamics give Cadence more resources to pursue new product initiatives while maintaining the flexibility to increase its sales and marketing investments.
One Reason to be Careful:
Long-Term Revenue Growth Disappoints
A company’s long-term sales performance is one signal of its overall quality. Any business can put up a good quarter or two, but many enduring ones grow for years. Over the last three years, Cadence grew its sales at a 15.6% compounded annual growth rate. Although this growth is acceptable on an absolute basis, it fell slightly short of our standards for the software sector, which enjoys a number of secular tailwinds. Luckily, there are other things to like about Cadence. 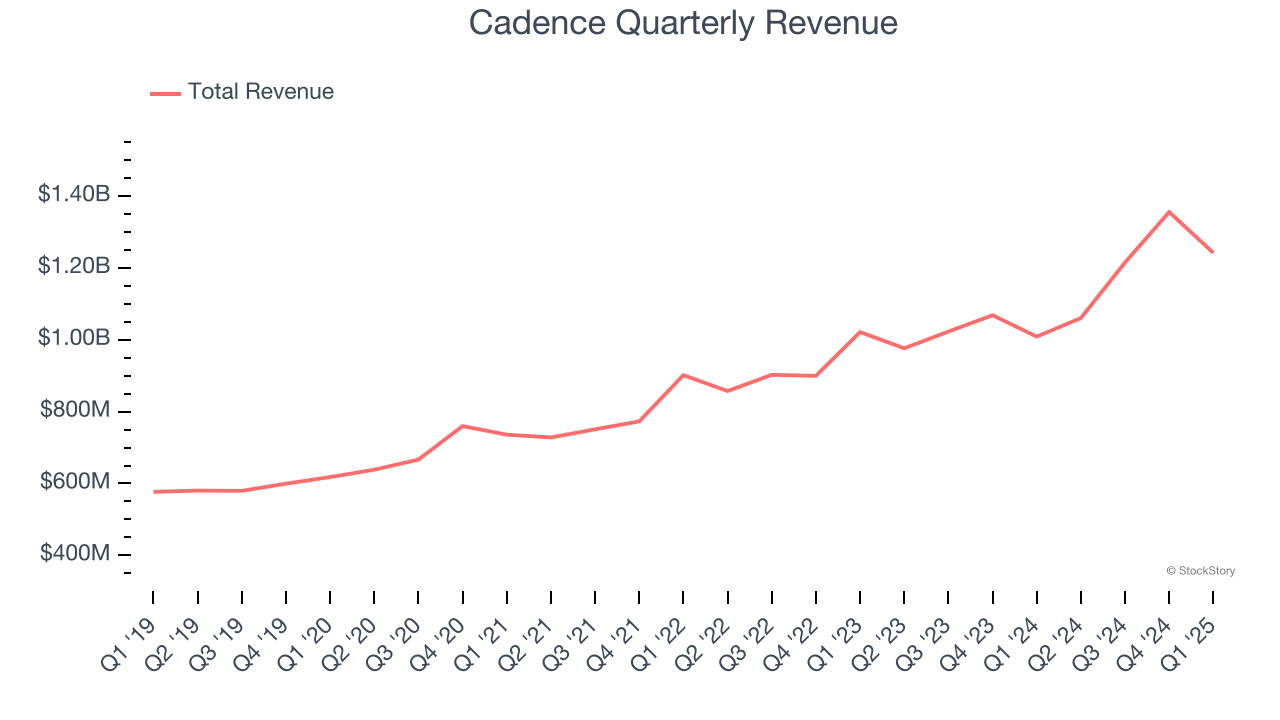
Final Judgment
Cadence’s merits more than compensate for its flaws, but at $297.30 per share (or 15.4× forward price-to-sales), is now the time to initiate a position? See for yourself in our in-depth research report, it’s free.
Stocks We Like Even More Than Cadence
The market surged in 2024 and reached record highs after Donald Trump’s presidential victory in November, but questions about new economic policies are adding much uncertainty for 2025.
While the crowd speculates what might happen next, we’re homing in on the companies that can succeed regardless of the political or macroeconomic environment. Put yourself in the driver’s seat and build a durable portfolio by checking out our Top 5 Strong Momentum Stocks for this week. This is a curated list of our High Quality stocks that have generated a market-beating return of 183% over the last five years (as of March 31st 2025).
Stocks that made our list in 2020 include now familiar names such as Nvidia (+1,545% between March 2020 and March 2025) as well as under-the-radar businesses like the once-micro-cap company Kadant (+351% five-year return). Find your next big winner with StockStory today.