
What a brutal six months it’s been for Leslie's. The stock has dropped 76.9% and now trades at $0.48, rattling many shareholders. This was partly driven by its softer quarterly results and might have investors contemplating their next move.
Is there a buying opportunity in Leslie's, or does it present a risk to your portfolio? Get the full stock story straight from our expert analysts, it’s free.
Why Do We Think Leslie's Will Underperform?
Even though the stock has become cheaper, we're cautious about Leslie's. Here are three reasons why you should be careful with LESL and a stock we'd rather own.
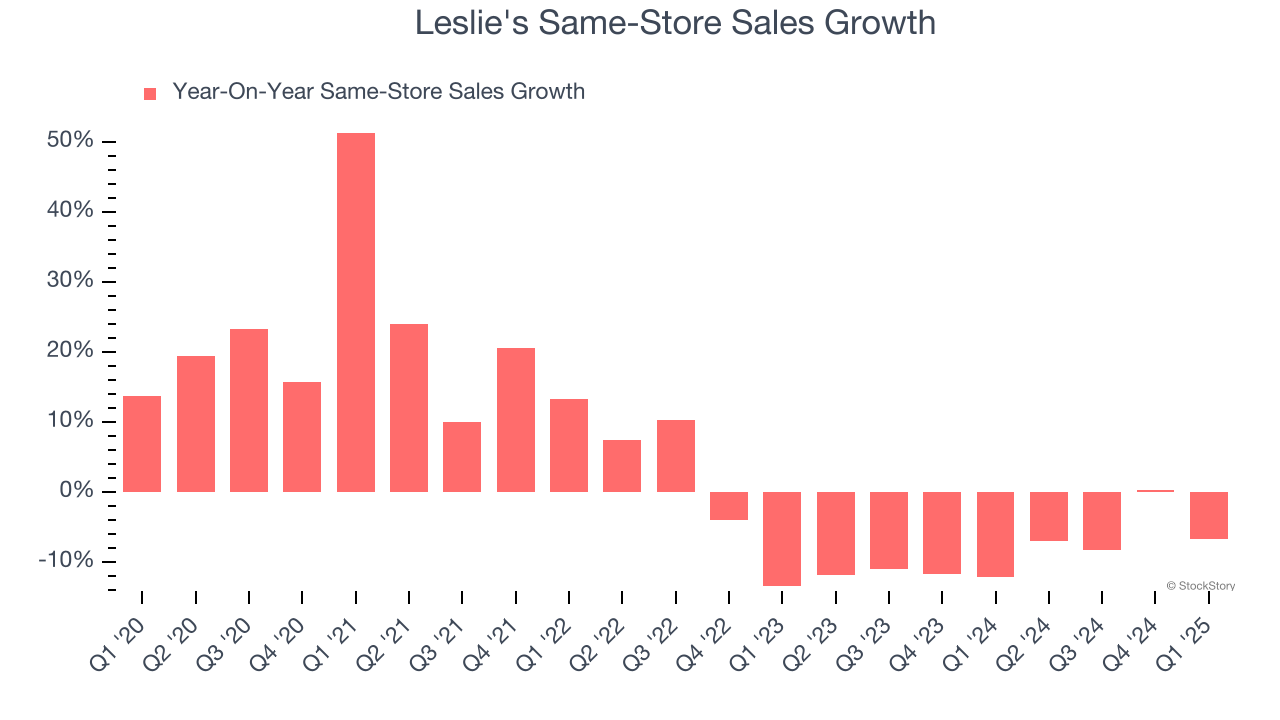
1. Shrinking Same-Store Sales Indicate Waning Demand
Same-store sales show the change in sales for a retailer's e-commerce platform and brick-and-mortar shops that have existed for at least a year. This is a key performance indicator because it measures organic growth.
Leslie’s demand has been shrinking over the last two years as its same-store sales have averaged 8.6% annual declines.
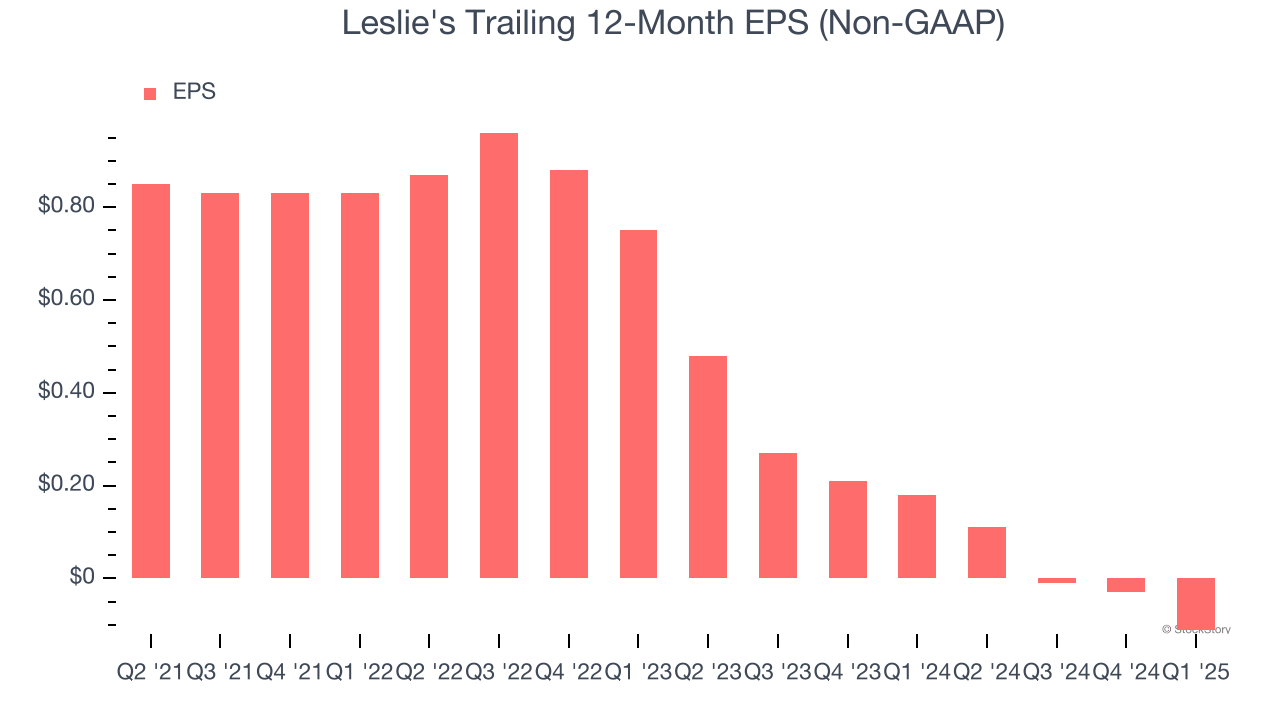
2. EPS Trending Down
We track the long-term change in earnings per share (EPS) because it highlights whether a company’s growth is profitable.
Leslie’s full-year EPS turned negative over the last four years. In a mature sector such as consumer retail, we tend to steer our readers away from companies with falling EPS because it could imply changing secular trends and preferences. If the tide turns unexpectedly, Leslie’s low margin of safety could leave its stock price susceptible to large downswings.
3. High Debt Levels Increase Risk
As long-term investors, the risk we care about most is the permanent loss of capital, which can happen when a company goes bankrupt or raises money from a disadvantaged position. This is separate from short-term stock price volatility, something we are much less bothered by.
Leslie’s $1.11 billion of debt exceeds the $17.25 million of cash on its balance sheet. Furthermore, its 12× net-debt-to-EBITDA ratio (based on its EBITDA of $87.06 million over the last 12 months) shows the company is overleveraged.
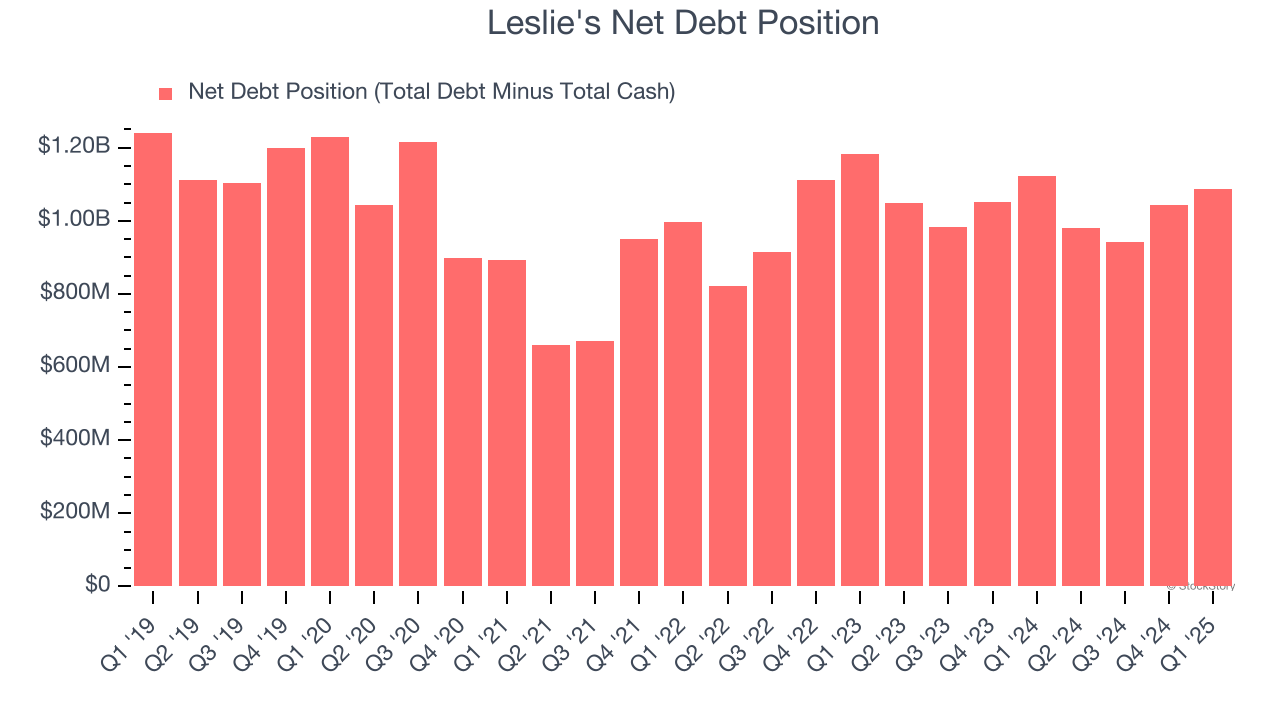
At this level of debt, incremental borrowing becomes increasingly expensive and credit agencies could downgrade the company’s rating if profitability falls. Leslie's could also be backed into a corner if the market turns unexpectedly – a situation we seek to avoid as investors in high-quality companies.
We hope Leslie's can improve its balance sheet and remain cautious until it increases its profitability or pays down its debt.
Final Judgment
We cheer for all companies serving everyday consumers, but in the case of Leslie's, we’ll be cheering from the sidelines. Following the recent decline, the stock trades at 6.6× forward P/E (or $0.48 per share). While this valuation is optically cheap, the potential downside is huge given its shaky fundamentals. There are superior stocks to buy right now. We’d suggest looking at the Amazon and PayPal of Latin America.
Stocks We Would Buy Instead of Leslie's
The market surged in 2024 and reached record highs after Donald Trump’s presidential victory in November, but questions about new economic policies are adding much uncertainty for 2025.
While the crowd speculates what might happen next, we’re homing in on the companies that can succeed regardless of the political or macroeconomic environment. Put yourself in the driver’s seat and build a durable portfolio by checking out our Top 5 Growth Stocks for this month. This is a curated list of our High Quality stocks that have generated a market-beating return of 183% over the last five years (as of March 31st 2025).
Stocks that made our list in 2020 include now familiar names such as Nvidia (+1,545% between March 2020 and March 2025) as well as under-the-radar businesses like the once-micro-cap company Tecnoglass (+1,754% five-year return). Find your next big winner with StockStory today.


