
The end of the earnings season is always a good time to take a step back and see who shined (and who not so much). Let’s take a look at how vertical software stocks fared in Q1, starting with Olo (NYSE: OLO).
Software is eating the world, and while a large number of solutions such as project management or video conferencing software can be useful to a wide array of industries, some have very specific needs. As a result, vertical software, which addresses industry-specific workflows, is growing and fueled by the pressures to improve productivity, whether it be for a life sciences, education, or banking company.
The 14 vertical software stocks we track reported a strong Q1. As a group, revenues beat analysts’ consensus estimates by 2.8% while next quarter’s revenue guidance was in line.
Thankfully, share prices of the companies have been resilient as they are up 8.2% on average since the latest earnings results.
Olo (NYSE: OLO)
Founded by Noah Glass, who wanted to get a cup of coffee faster on his way to work, Olo (NYSE: OLO) provides restaurants and food retailers with software to manage food orders and delivery.
Olo reported revenues of $80.68 million, up 21.3% year on year. This print exceeded analysts’ expectations by 4.1%. Overall, it was a very strong quarter for the company with an impressive beat of analysts’ billings estimates and a solid beat of analysts’ EBITDA estimates.
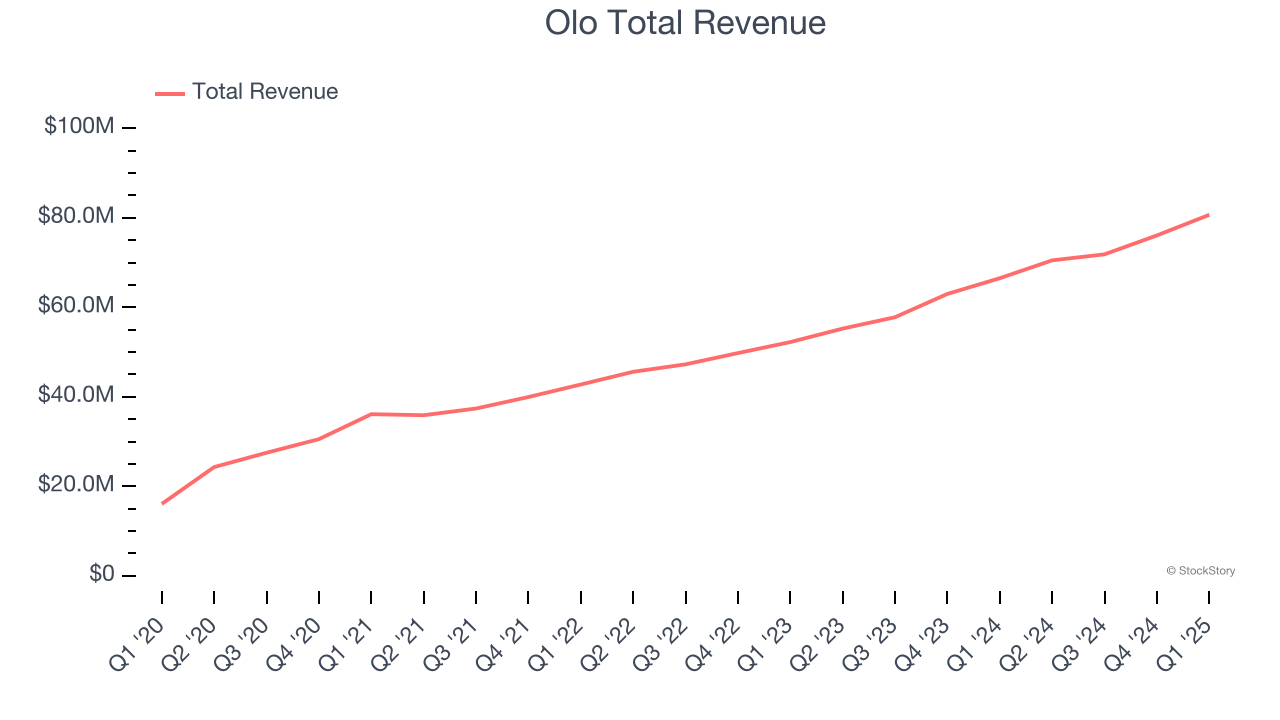
The stock is up 6% since reporting and currently trades at $8.52.
Is now the time to buy Olo? Access our full analysis of the earnings results here, it’s free.
Best Q1: Veeva Systems (NYSE: VEEV)
Built on top of Salesforce as one of the first vertical-focused cloud platforms, Veeva (NYSE: VEEV) provides data and customer relationship management (CRM) software for organizations in the life sciences industry.
Veeva Systems reported revenues of $759 million, up 16.7% year on year, outperforming analysts’ expectations by 4.2%. The business had an exceptional quarter with a solid beat of analysts’ billings estimates and EPS guidance for next quarter exceeding analysts’ expectations.
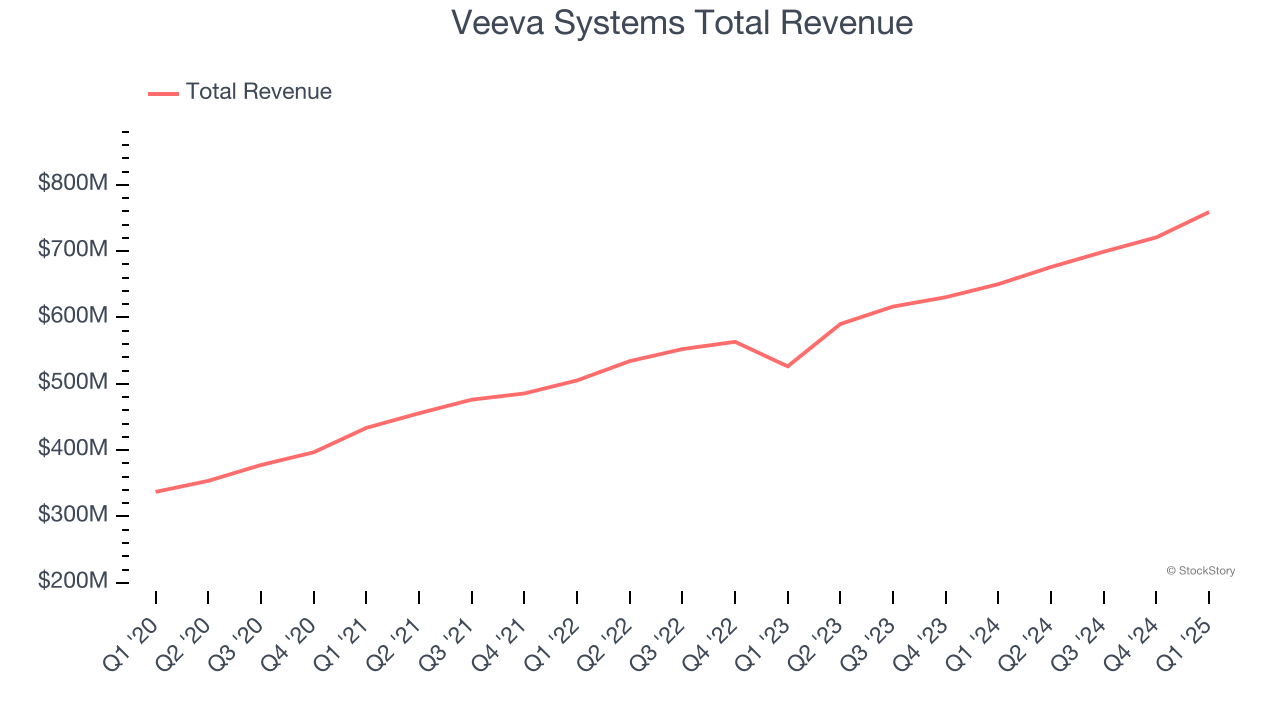
Veeva Systems delivered the highest full-year guidance raise among its peers. The market seems happy with the results as the stock is up 19.7% since reporting. It currently trades at $281.43.
Is now the time to buy Veeva Systems? Access our full analysis of the earnings results here, it’s free.
Weakest Q1: Doximity (NYSE: DOCS)
Founded in 2010 and named for a combination of “docs” and “proximity”, Doximity (NYSE: DOCS) is the leading social network for U.S. medical professionals.
Doximity reported revenues of $138.3 million, up 17.1% year on year, exceeding analysts’ expectations by 3.5%. Still, it was a weaker quarter as it posted full-year guidance of slowing revenue growth and EBITDA guidance for next quarter missing analysts’ expectations.
As expected, the stock is down 2.4% since the results and currently trades at $57.04.
Read our full analysis of Doximity’s results here.
Autodesk (NASDAQ: ADSK)
Founded in 1982 by John Walker and growing into one of the industry's behemoths, Autodesk (NASDAQ: ADSK) makes computer-aided design (CAD) software for engineering, construction, and architecture companies.
Autodesk reported revenues of $1.63 billion, up 15.2% year on year. This print surpassed analysts’ expectations by 1.7%. Overall, it was a very strong quarter as it also put up EPS guidance for next quarter exceeding analysts’ expectations and an impressive beat of analysts’ EBITDA estimates.
The stock is flat since reporting and currently trades at $295.19.
Read our full, actionable report on Autodesk here, it’s free.
Q2 Holdings (NYSE: QTWO)
Founded in 2004 by Hank Seale, Q2 (NYSE: QTWO) offers software-as-a-service that enables small banks to provide online banking and consumer lending services to their clients.
Q2 Holdings reported revenues of $189.7 million, up 14.6% year on year. This number topped analysts’ expectations by 1.7%. It was a very strong quarter as it also logged an impressive beat of analysts’ billings estimates and a solid beat of analysts’ EBITDA estimates.
The stock is up 10.7% since reporting and currently trades at $88.95.
Read our full, actionable report on Q2 Holdings here, it’s free.
Market Update
The Fed’s interest rate hikes throughout 2022 and 2023 have successfully cooled post-pandemic inflation, bringing it closer to the 2% target. Inflationary pressures have eased without tipping the economy into a recession, suggesting a soft landing. This stability, paired with recent rate cuts (0.5% in September 2024 and 0.25% in November 2024), fueled a strong year for the stock market in 2024. The markets surged further after Donald Trump’s presidential victory in November, with major indices reaching record highs in the days following the election. Still, questions remain about the direction of economic policy, as potential tariffs and corporate tax changes add uncertainty for 2025.
Want to invest in winners with rock-solid fundamentals? Check out our Top 5 Quality Compounder Stocks and add them to your watchlist. These companies are poised for growth regardless of the political or macroeconomic climate.


