As the Q1 earnings season wraps, let’s dig into this quarter’s best and worst performers in the professional tools and equipment industry, including Snap-on (NYSE: SNA) and its peers.
Automation that increases efficiency and connected equipment that collects analyzable data have been trending, creating new demand. Some professional tools and equipment companies also provide software to accompany measurement or automated machinery, adding a stream of recurring revenues to their businesses. On the other hand, professional tools and equipment companies are at the whim of economic cycles. Consumer spending and interest rates, for example, can greatly impact the industrial production that drives demand for these companies’ offerings.
The 10 professional tools and equipment stocks we track reported a mixed Q1. As a group, revenues missed analysts’ consensus estimates by 0.6% while next quarter’s revenue guidance was 1.1% above.
In light of this news, share prices of the companies have held steady as they are up 2.1% on average since the latest earnings results.
Weakest Q1: Snap-on (NYSE: SNA)
Founded in 1920, Snap-on (NYSE: SNA) is a global provider of tools, equipment, and diagnostics for various industries such as vehicle repair, aerospace, and the military.
Snap-on reported revenues of $1.24 billion, down 3% year on year. This print fell short of analysts’ expectations by 4.1%. Overall, it was a disappointing quarter for the company with a significant miss of analysts’ adjusted operating income estimates.
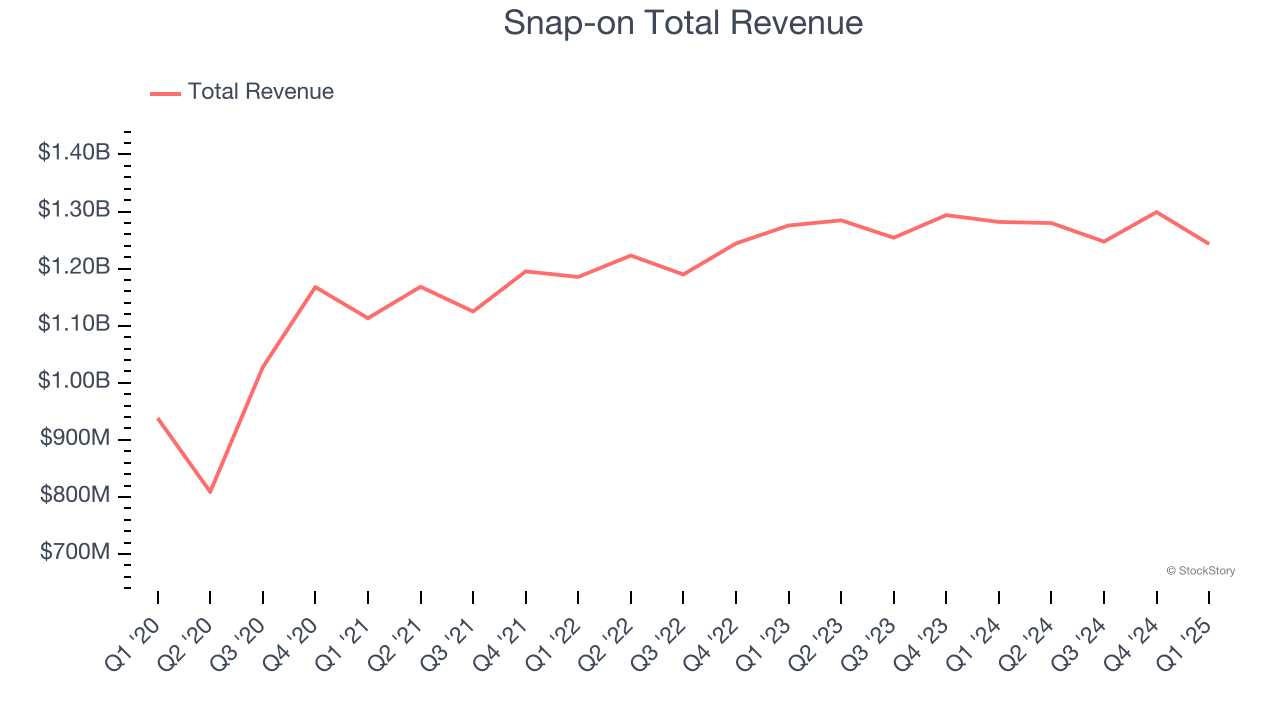
Snap-on delivered the weakest performance against analyst estimates of the whole group. Unsurprisingly, the stock is down 7.1% since reporting and currently trades at $308.33.
Read our full report on Snap-on here, it’s free.
Best Q1: ESAB (NYSE: ESAB)
Having played a significant role in the construction of the iconic Sydney Opera House, ESAB (NYSE: ESAB) manufactures and sells welding and cutting equipment for numerous industries.
ESAB reported revenues of $678.1 million, down 1.7% year on year, outperforming analysts’ expectations by 2.2%. The business had a very strong quarter with an impressive beat of analysts’ EBITDA estimates.
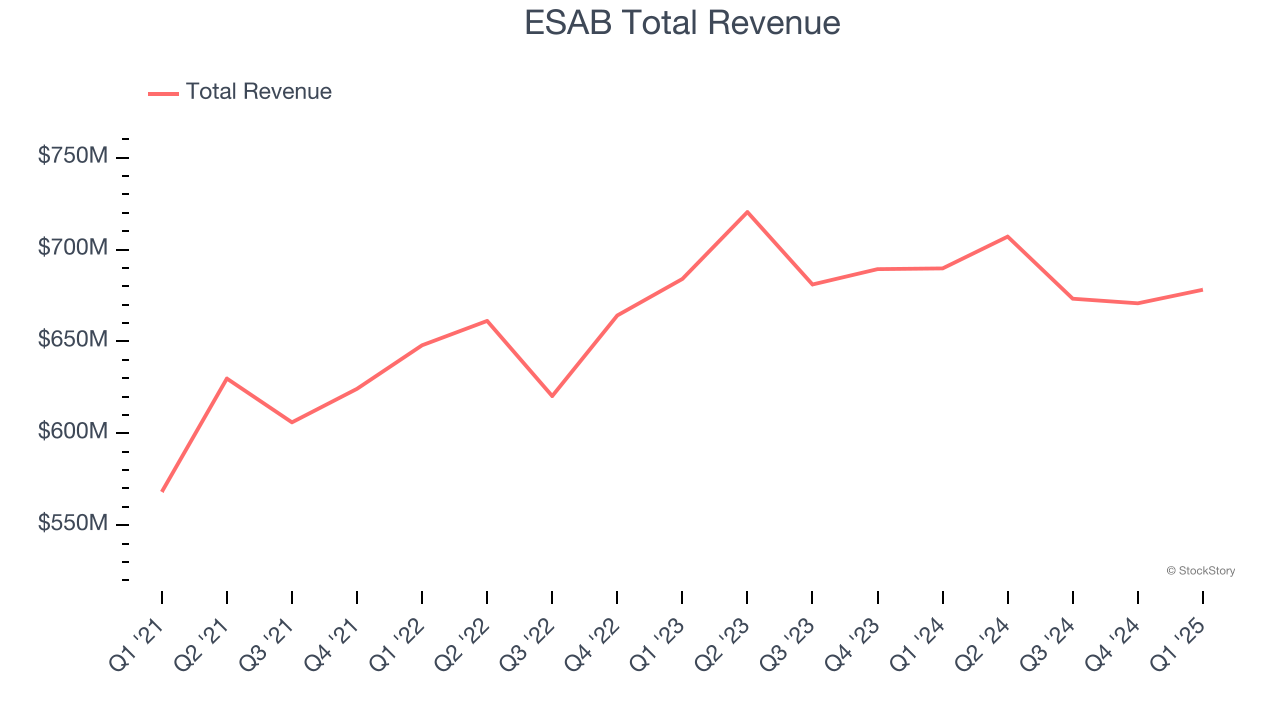
Although it had a fine quarter compared its peers, the market seems unhappy with the results as the stock is down 2.3% since reporting. It currently trades at $117.40.
Is now the time to buy ESAB? Access our full analysis of the earnings results here, it’s free.
Hyster-Yale Materials Handling (NYSE: HY)
Playing a significant role in the development of the hydraulic lift truck, Hyster-Yale (NYSE: HY) designs, manufactures, and sells materials handling equipment to various sectors.
Hyster-Yale Materials Handling reported revenues of $910.4 million, down 13.8% year on year, falling short of analysts’ expectations by 3.9%. It was a disappointing quarter as it posted a significant miss of analysts’ EBITDA and EPS estimates.
Hyster-Yale Materials Handling delivered the slowest revenue growth in the group. As expected, the stock is down 4.7% since the results and currently trades at $38.62.
Read our full analysis of Hyster-Yale Materials Handling’s results here.
Stanley Black & Decker (NYSE: SWK)
With an iconic “STANLEY” logo which has remained virtually unchanged for over a century, Stanley Black & Decker (NYSE: SWK) is a manufacturer primarily catering to the tool and outdoor equipment industry.
Stanley Black & Decker reported revenues of $3.74 billion, down 3.2% year on year. This print topped analysts’ expectations by 1.7%. Zooming out, it was a satisfactory quarter as it also logged a solid beat of analysts’ EPS estimates but a miss of analysts’ adjusted operating income estimates.
The stock is up 7.9% since reporting and currently trades at $66.
Read our full, actionable report on Stanley Black & Decker here, it’s free.
Fortive (NYSE: FTV)
Taking its name from the Latin root of "strong", Fortive (NYSE: FTV) manufactures products and develops industrial software for numerous industries.
Fortive reported revenues of $1.47 billion, down 3.3% year on year. This result lagged analysts' expectations by 1.4%. More broadly, it was a mixed quarter as it also recorded an impressive beat of analysts’ adjusted operating income estimates but EPS guidance for next quarter missing analysts’ expectations significantly.
The stock is up 1% since reporting and currently trades at $70.32.
Read our full, actionable report on Fortive here, it’s free.
Market Update
The Fed’s interest rate hikes throughout 2022 and 2023 have successfully cooled post-pandemic inflation, bringing it closer to the 2% target. Inflationary pressures have eased without tipping the economy into a recession, suggesting a soft landing. This stability, paired with recent rate cuts (0.5% in September 2024 and 0.25% in November 2024), fueled a strong year for the stock market in 2024. The markets surged further after Donald Trump’s presidential victory in November, with major indices reaching record highs in the days following the election. Still, questions remain about the direction of economic policy, as potential tariffs and corporate tax changes add uncertainty for 2025.
Want to invest in winners with rock-solid fundamentals? Check out our Top 5 Growth Stocks and add them to your watchlist. These companies are poised for growth regardless of the political or macroeconomic climate.