
IT distribution giant TD SYNNEX (NYSE: SNX) reported revenue ahead of Wall Street’s expectations in Q2 CY2025, with sales up 7.2% year on year to $14.95 billion. The company expects next quarter’s revenue to be around $15.1 billion, close to analysts’ estimates. Its non-GAAP profit of $2.99 per share was 10.1% above analysts’ consensus estimates.
Is now the time to buy TD SYNNEX? Find out by accessing our full research report, it’s free.
TD SYNNEX (SNX) Q2 CY2025 Highlights:
- Revenue: $14.95 billion vs analyst estimates of $14.31 billion (7.2% year-on-year growth, 4.4% beat)
- Adjusted EPS: $2.99 vs analyst estimates of $2.72 (10.1% beat)
- Adjusted EBITDA: $444.3 million vs analyst estimates of $412.7 million (3% margin, 7.7% beat)
- Revenue Guidance for Q3 CY2025 is $15.1 billion at the midpoint, roughly in line with what analysts were expecting
- Adjusted EPS guidance for Q3 CY2025 is $3 at the midpoint, above analyst estimates of $2.96
- Operating Margin: 2.2%, in line with the same quarter last year
- Free Cash Flow was $542.9 million, up from -$152.5 million in the same quarter last year
- Market Capitalization: $10.71 billion
“Our Q2 results demonstrate the continued strength of the IT Distribution and Hyperscaler markets, meanwhile, our strategy and the execution of our team are enabling us to grow ahead of market,” said Patrick Zammit, CEO of TD SYNNEX.
Company Overview
Serving as the crucial middleman in the technology supply chain, TD SYNNEX (NYSE: SNX) is a global technology distributor that connects thousands of IT manufacturers with resellers, helping businesses access hardware, software, and technology solutions.
Revenue Growth
A company’s long-term sales performance can indicate its overall quality. Any business can have short-term success, but a top-tier one grows for years.
With $60.01 billion in revenue over the past 12 months, TD SYNNEX is a behemoth in the business services sector and benefits from economies of scale, giving it an edge in distribution. This also enables it to gain more leverage on its fixed costs than smaller competitors and the flexibility to offer lower prices.
As you can see below, TD SYNNEX’s 23% annualized revenue growth over the last five years was incredible. This shows it had high demand, a useful starting point for our analysis.
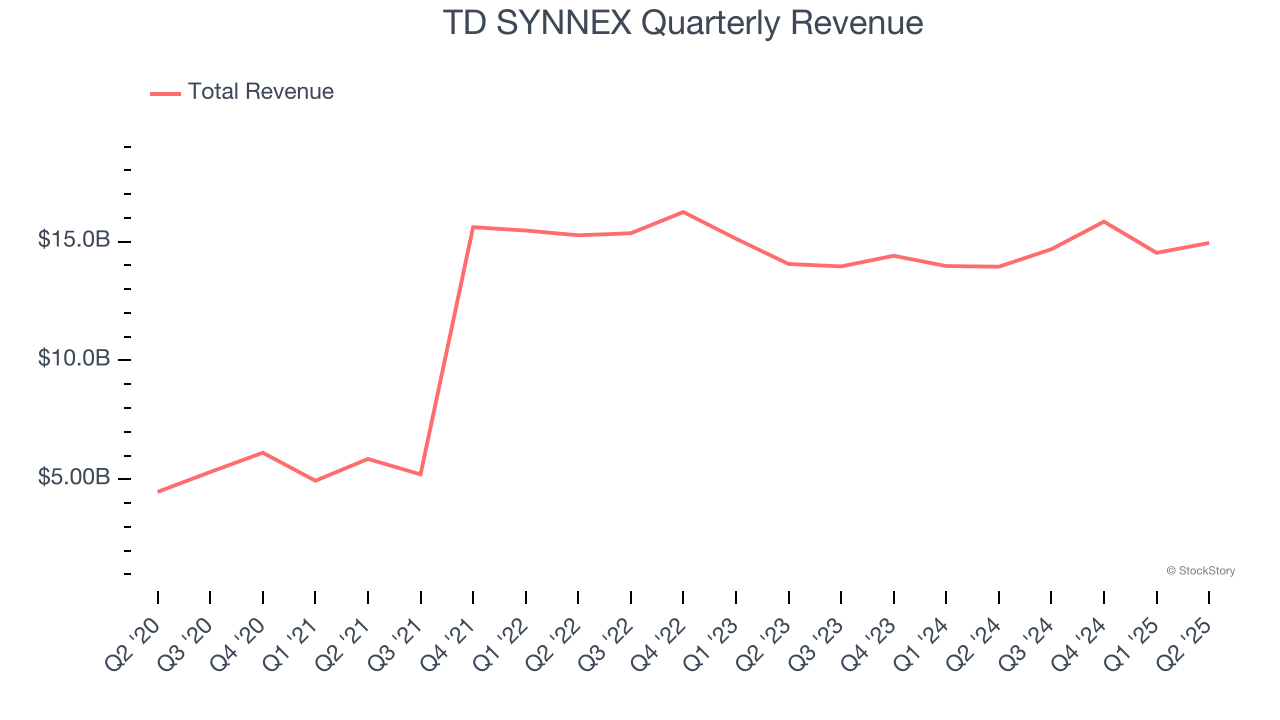
We at StockStory place the most emphasis on long-term growth, but within business services, a half-decade historical view may miss recent innovations or disruptive industry trends. TD SYNNEX’s recent performance shows its demand has slowed significantly as its revenue was flat over the last two years. 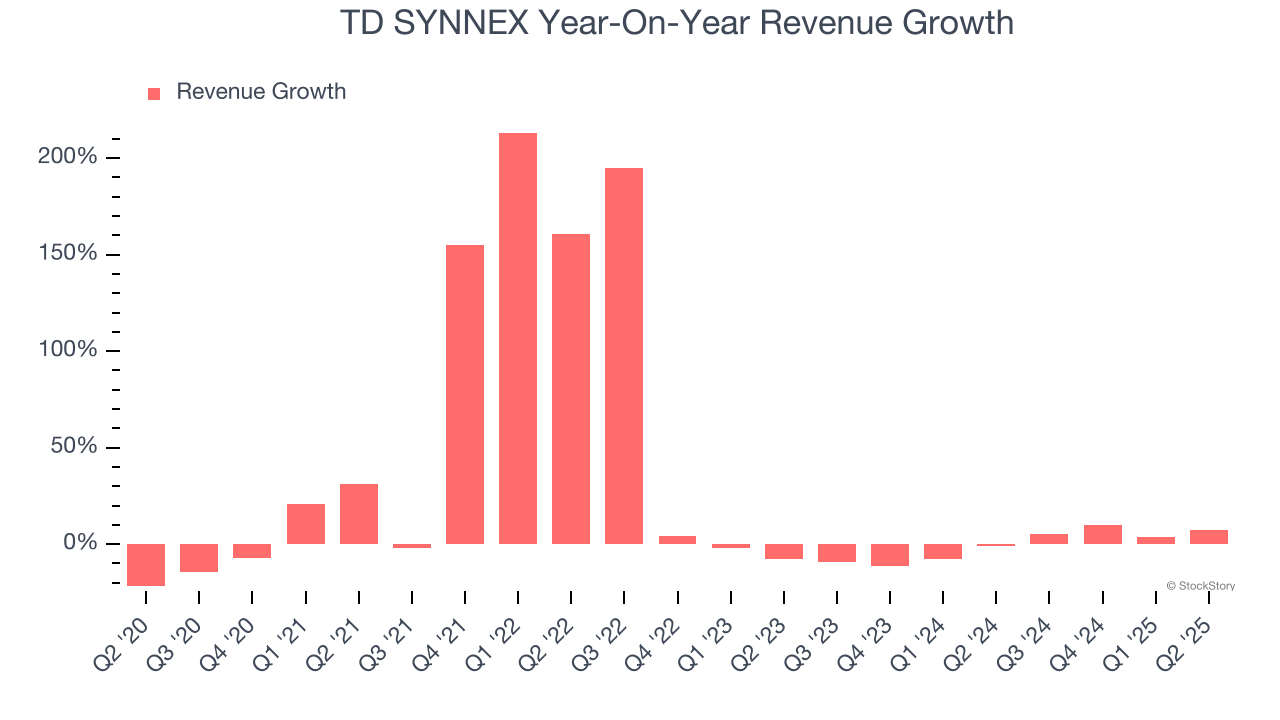
This quarter, TD SYNNEX reported year-on-year revenue growth of 7.2%, and its $14.95 billion of revenue exceeded Wall Street’s estimates by 4.4%. Company management is currently guiding for a 2.8% year-on-year increase in sales next quarter.
Looking further ahead, sell-side analysts expect revenue to grow 1.7% over the next 12 months. While this projection indicates its newer products and services will spur better top-line performance, it is still below the sector average.
Today’s young investors won’t have read the timeless lessons in Gorilla Game: Picking Winners In High Technology because it was written more than 20 years ago when Microsoft and Apple were first establishing their supremacy. But if we apply the same principles, then enterprise software stocks leveraging their own generative AI capabilities may well be the Gorillas of the future. So, in that spirit, we are excited to present our Special Free Report on a profitable, fast-growing enterprise software stock that is already riding the automation wave and looking to catch the generative AI next.
Operating Margin
TD SYNNEX’s operating margin might fluctuated slightly over the last 12 months but has remained more or less the same, averaging 2% over the last five years. This profitability was inadequate for a business services business and caused by its suboptimal cost structure.
Looking at the trend in its profitability, TD SYNNEX’s operating margin might fluctuated slightly but has generally stayed the same over the last five years. This raises questions about the company’s expense base because its revenue growth should have given it leverage on its fixed costs, resulting in better economies of scale and profitability.
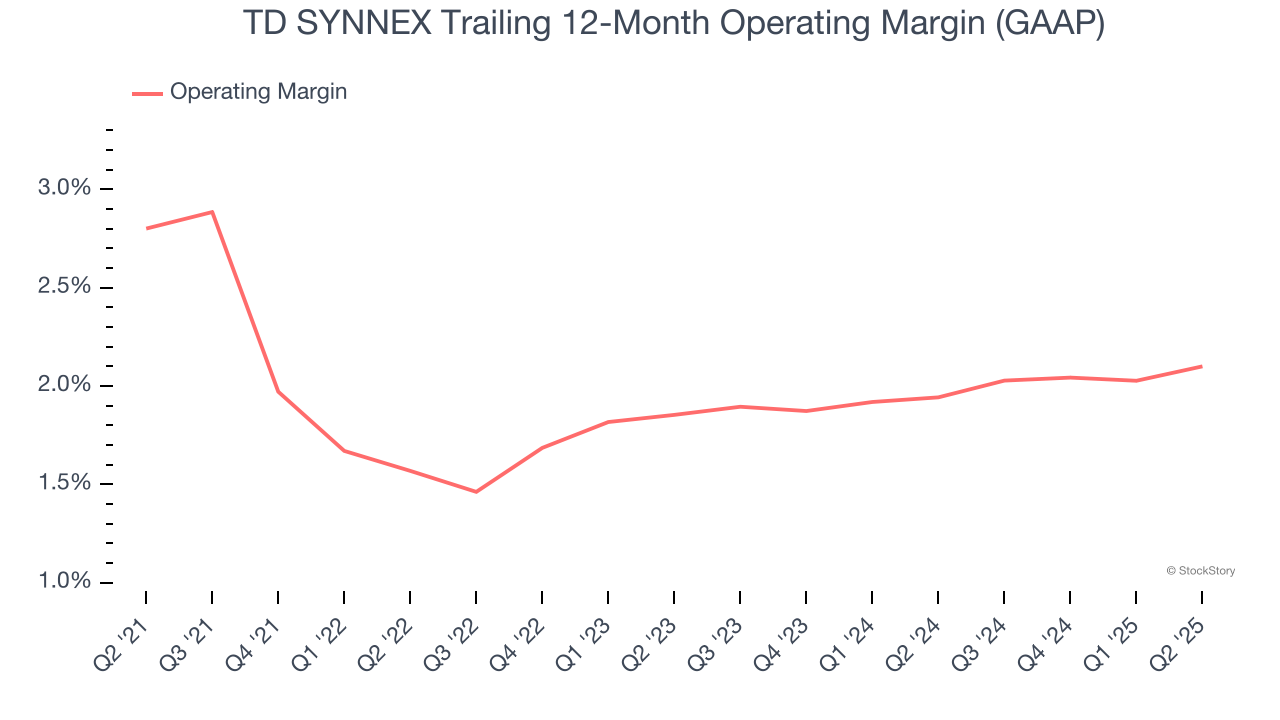
In Q2, TD SYNNEX generated an operating margin profit margin of 2.2%, in line with the same quarter last year. This indicates the company’s overall cost structure has been relatively stable.
Earnings Per Share
We track the long-term change in earnings per share (EPS) for the same reason as long-term revenue growth. Compared to revenue, however, EPS highlights whether a company’s growth is profitable.
Sadly for TD SYNNEX, its EPS declined by 1.5% annually over the last five years while its revenue grew by 23%. However, its operating margin didn’t change during this time, telling us that non-fundamental factors such as interest and taxes affected its ultimate earnings.
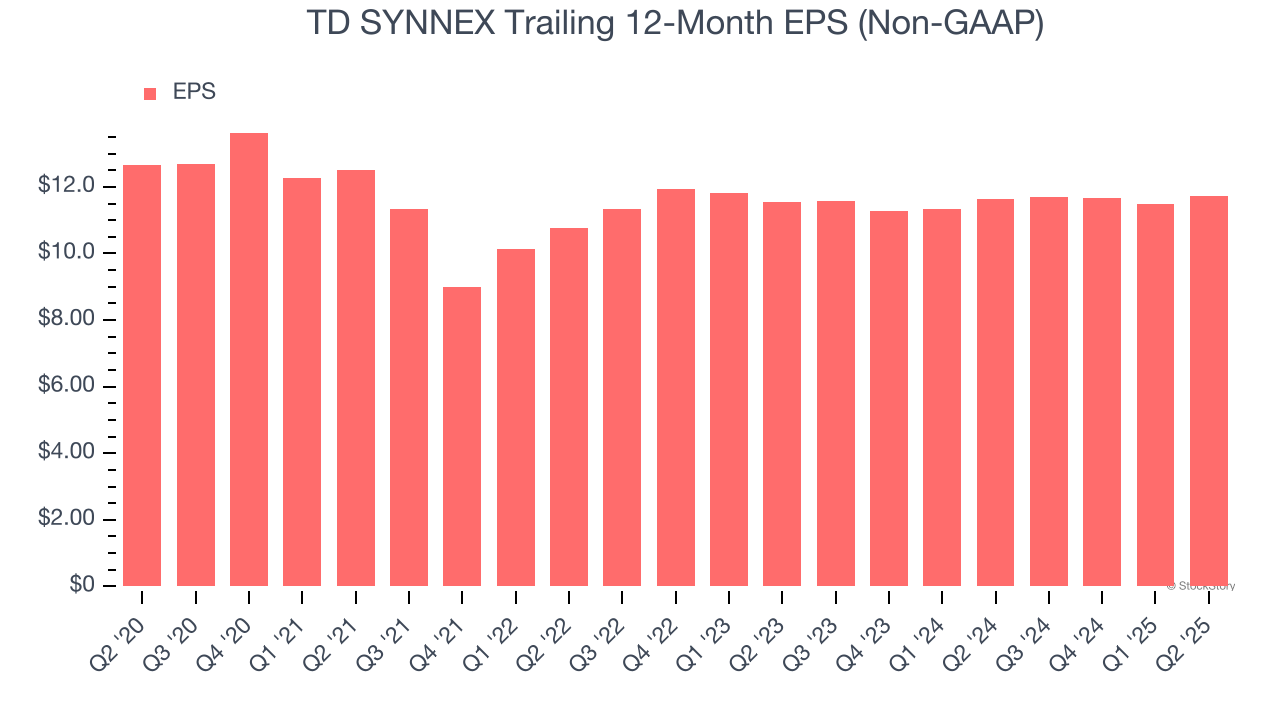
In Q2, TD SYNNEX reported EPS at $2.99, up from $2.73 in the same quarter last year. This print easily cleared analysts’ estimates, and shareholders should be content with the results. Over the next 12 months, Wall Street expects TD SYNNEX’s full-year EPS of $11.74 to grow 6.8%.
Key Takeaways from TD SYNNEX’s Q2 Results
We enjoyed seeing TD SYNNEX beat analysts’ revenue expectations this quarter. We were also glad its EPS outperformed Wall Street’s estimates. Overall, we think this was a decent quarter with some key metrics above expectations. The stock traded up 3.4% to $131.99 immediately after reporting.
TD SYNNEX put up rock-solid earnings, but one quarter doesn’t necessarily make the stock a buy. Let’s see if this is a good investment. What happened in the latest quarter matters, but not as much as longer-term business quality and valuation, when deciding whether to invest in this stock. We cover that in our actionable full research report which you can read here, it’s free.


