Quarterly earnings results are a good time to check in on a company’s progress, especially compared to its peers in the same sector. Today we are looking at Sensata Technologies (NYSE: ST) and the best and worst performers in the analog semiconductors industry.
Demand for analog chips is generally linked to the overall level of economic growth, as analog chips serve as the building blocks of most electronic goods and equipment. Unlike digital chip designers, analog chip makers tend to produce the majority of their own chips, as analog chip production does not require expensive leading edge nodes. Less dependent on major secular growth drivers, analog product cycles are much longer, often 5-7 years.
The 15 analog semiconductors stocks we track reported a strong Q1. As a group, revenues beat analysts’ consensus estimates by 2.2% while next quarter’s revenue guidance was 0.9% above.
Luckily, analog semiconductors stocks have performed well with share prices up 22.1% on average since the latest earnings results.
Sensata Technologies (NYSE: ST)
Originally a temperature sensor control maker and a subsidiary of Texas Instruments for 60 years, Sensata Technology Holdings (NYSE: ST) is a leading supplier of analog sensors used in industrial and transportation applications, best known for its dominant position in the tire pressure monitoring systems in cars.
Sensata Technologies reported revenues of $911.3 million, down 9.5% year on year. This print exceeded analysts’ expectations by 3.5%. Overall, it was a strong quarter for the company with an impressive beat of analysts’ EPS estimates and a solid beat of analysts’ adjusted operating income estimates.
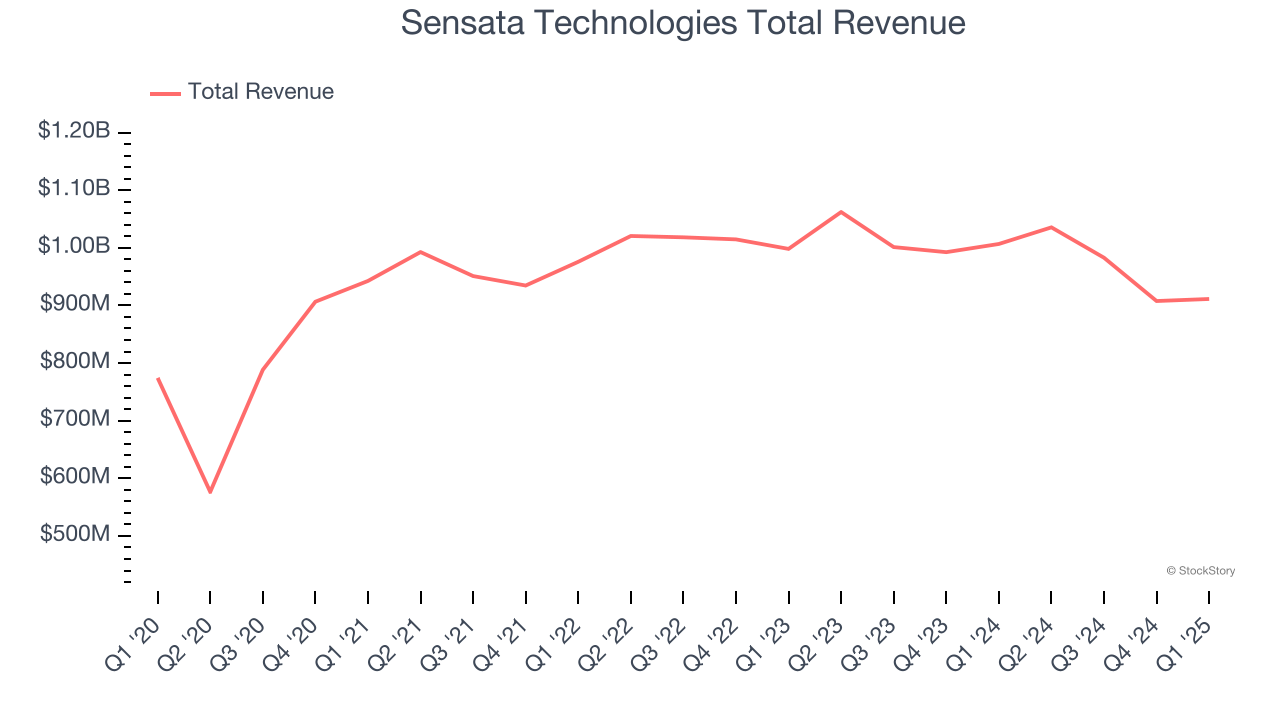
Interestingly, the stock is up 33.3% since reporting and currently trades at $29.96.
Is now the time to buy Sensata Technologies? Access our full analysis of the earnings results here, it’s free.
Best Q1: Himax (NASDAQ: HIMX)
Taiwan-based Himax Technologies (NASDAQ: HIMX) is a leading manufacturer of display driver chips and timing controllers used in TVs, laptops, and mobile phones.
Himax reported revenues of $215.1 million, up 3.7% year on year, outperforming analysts’ expectations by 2.4%. The business had an exceptional quarter with an impressive beat of analysts’ EPS estimates and revenue guidance for next quarter exceeding analysts’ expectations.
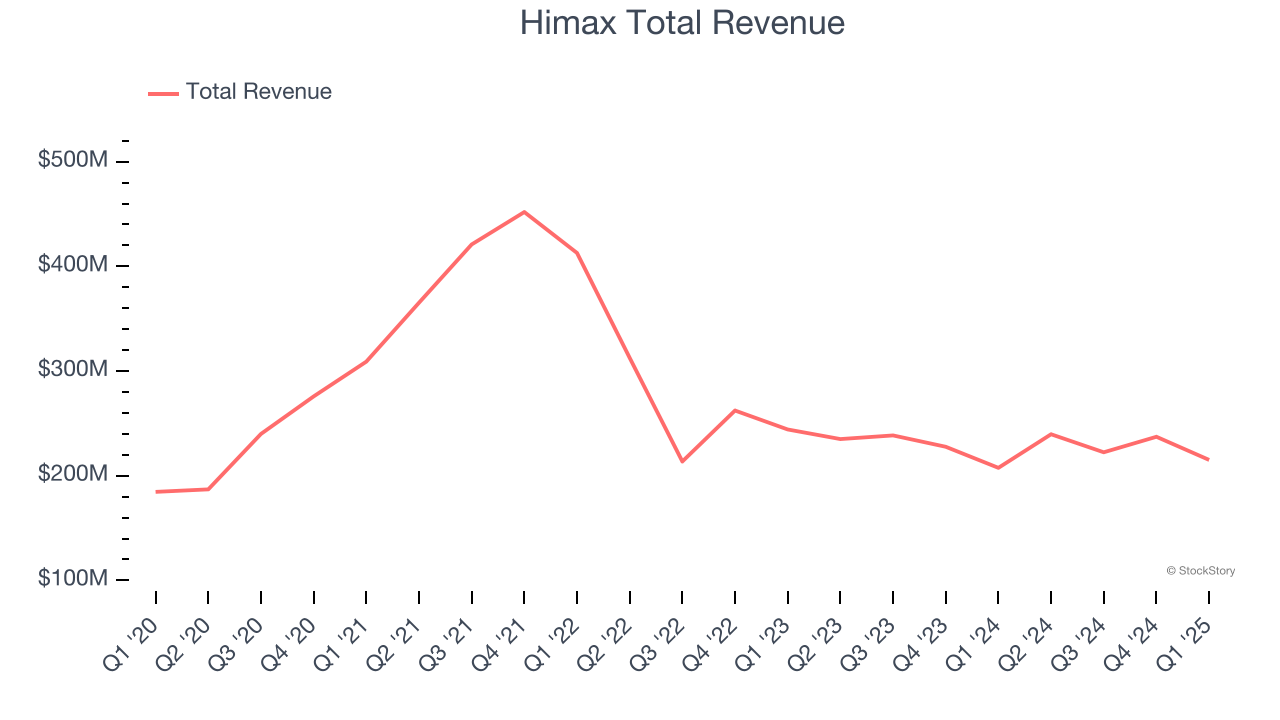
The market seems happy with the results as the stock is up 26.7% since reporting. It currently trades at $9.45.
Is now the time to buy Himax? Access our full analysis of the earnings results here, it’s free.
Weakest Q1: Vishay Intertechnology (NYSE: VSH)
Named after the founder's ancestral village in present-day Lithuania, Vishay Intertechnology (NYSE: VSH) manufactures simple chips and electronic components that are building blocks of virtually all types of electronic devices.
Vishay Intertechnology reported revenues of $715.2 million, down 4.2% year on year, falling short of analysts’ expectations by 0.6%. It was a slower quarter as it posted a significant miss of analysts’ EPS estimates.
Vishay Intertechnology delivered the weakest performance against analyst estimates in the group. Interestingly, the stock is up 18.3% since the results and currently trades at $15.89.
Read our full analysis of Vishay Intertechnology’s results here.
Power Integrations (NASDAQ: POWI)
A leading supplier of parts for electronics such as home appliances, Power Integrations (NASDAQ: POWI) is a semiconductor designer and developer specializing in products used for high-voltage power conversion.
Power Integrations reported revenues of $105.5 million, up 15.1% year on year. This result met analysts’ expectations. It was a very strong quarter as it also produced a solid beat of analysts’ EPS estimates and an impressive beat of analysts’ adjusted operating income estimates.
The stock is down 5.5% since reporting and currently trades at $55.80.
Read our full, actionable report on Power Integrations here, it’s free.
Microchip Technology (NASDAQ: MCHP)
Spun out from General Instrument in 1987, Microchip Technology (NASDAQ: MCHP) is a leading provider of microcontrollers and integrated circuits used mainly in the automotive world, especially in electric vehicles and their charging devices.
Microchip Technology reported revenues of $970.5 million, down 26.8% year on year. This print beat analysts’ expectations by 1%. Zooming out, it was a mixed quarter as it also logged an impressive beat of analysts’ EPS estimates but revenue guidance for next quarter slightly missing analysts’ expectations.
Microchip Technology had the slowest revenue growth among its peers. The stock is up 43.3% since reporting and currently trades at $70.40.
Read our full, actionable report on Microchip Technology here, it’s free.
Market Update
Thanks to the Fed’s series of rate hikes in 2022 and 2023, inflation has cooled significantly from its post-pandemic highs, drawing closer to the 2% goal. This disinflation has occurred without severely impacting economic growth, suggesting the success of a soft landing. The stock market thrived in 2024, spurred by recent rate cuts (0.5% in September and 0.25% in November), and a notable surge followed Donald Trump’s presidential election win in November, propelling indices to historic highs. Nonetheless, the outlook for 2025 remains clouded by potential trade policy changes and corporate tax discussions, which could impact business confidence and growth. The path forward holds both optimism and caution as new policies take shape.
Want to invest in winners with rock-solid fundamentals? Check out our Top 5 Quality Compounder Stocks and add them to your watchlist. These companies are poised for growth regardless of the political or macroeconomic climate.