Let’s dig into the relative performance of Gibraltar (NASDAQ: ROCK) and its peers as we unravel the now-completed Q1 home construction materials earnings season.
Traditionally, home construction materials companies have built economic moats with expertise in specialized areas, brand recognition, and strong relationships with contractors. More recently, advances to address labor availability and job site productivity have spurred innovation that is driving incremental demand. However, these companies are at the whim of residential construction volumes, which tend to be cyclical and can be impacted heavily by economic factors such as interest rates. Additionally, the costs of raw materials can be driven by a myriad of worldwide factors and greatly influence the profitability of home construction materials companies.
The 12 home construction materials stocks we track reported a satisfactory Q1. As a group, revenues were in line with analysts’ consensus estimates.
In light of this news, share prices of the companies have held steady. On average, they are relatively unchanged since the latest earnings results.
Gibraltar (NASDAQ: ROCK)
Gibraltar (NASDAQ: ROCK) makes renewable energy, agriculture technology and infrastructure products. Its mission statement is to make everyday living more sustainable.
Gibraltar reported revenues of $290 million, flat year on year. This print fell short of analysts’ expectations by 2.3%, but it was still a strong quarter for the company with an impressive beat of analysts’ EBITDA estimates and full-year EPS guidance exceeding analysts’ expectations.
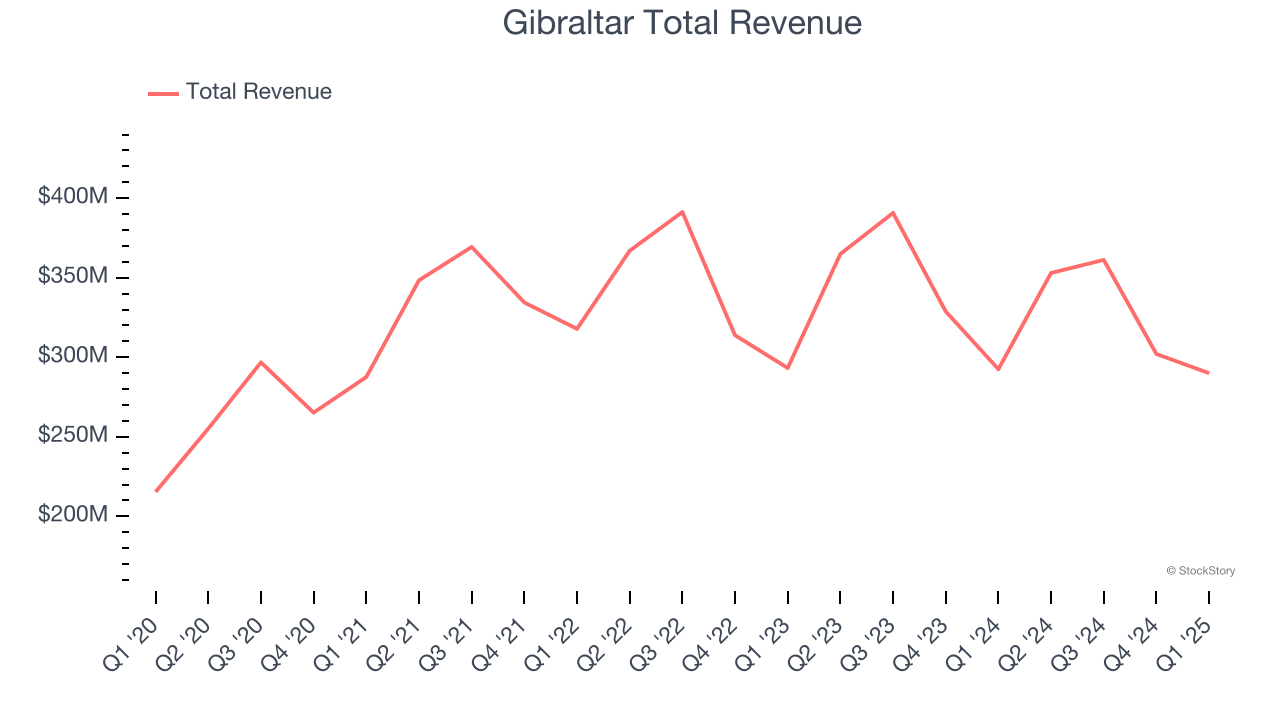
Interestingly, the stock is up 15% since reporting and currently trades at $60.73.
Is now the time to buy Gibraltar? Access our full analysis of the earnings results here, it’s free.
Best Q1: Simpson (NYSE: SSD)
Aiming to build safer and stronger buildings, Simpson (NYSE: SSD) designs and manufactures structural connectors, anchors, and other construction products.
Simpson reported revenues of $538.9 million, up 1.6% year on year, outperforming analysts’ expectations by 2%. The business had an exceptional quarter with an impressive beat of analysts’ EBITDA estimates and a solid beat of analysts’ EPS estimates.
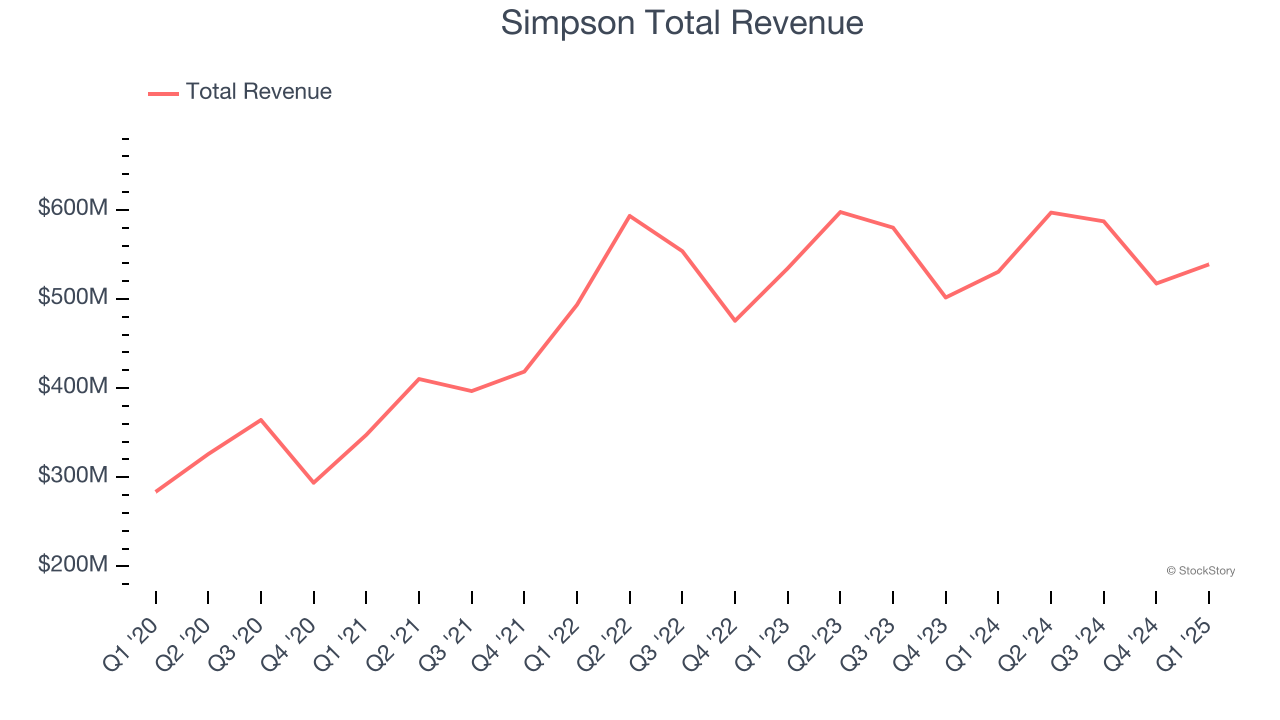
The market seems content with the results as the stock is up 2.4% since reporting. It currently trades at $157.11.
Is now the time to buy Simpson? Access our full analysis of the earnings results here, it’s free.
Weakest Q1: Masco (NYSE: MAS)
Headquartered just outside of Detroit, MI, Masco (NYSE: MAS) designs and manufactures home-building products such as glass shower doors, decorative lighting, bathtubs, and faucets.
Masco reported revenues of $1.80 billion, down 6.5% year on year, falling short of analysts’ expectations by 2%. It was a disappointing quarter as it posted a significant miss of analysts’ adjusted operating income estimates.
Interestingly, the stock is up 4.6% since the results and currently trades at $64.17.
Read our full analysis of Masco’s results here.
Owens Corning (NYSE: OC)
Credited with the discovery of fiberglass, Owens Corning (NYSE: OC) supplies building and construction materials to the United States and international markets.
Owens Corning reported revenues of $2.53 billion, up 25.4% year on year. This number surpassed analysts’ expectations by 0.7%. Zooming out, it was a slower quarter as it logged a significant miss of analysts’ organic revenue estimates.
The stock is down 3.2% since reporting and currently trades at $138.02.
Read our full, actionable report on Owens Corning here, it’s free.
American Woodmark (NASDAQ: AMWD)
Starting as a small millwork shop, American Woodmark (NASDAQ: AMWD) is a cabinet manufacturing company that helps customers from inspiration to installation.
American Woodmark reported revenues of $400.4 million, down 11.7% year on year. This print missed analysts’ expectations by 6.6%. Overall, it was a softer quarter as it also logged full-year EBITDA guidance missing analysts’ expectations significantly and a miss of analysts’ EBITDA estimates.
American Woodmark had the weakest performance against analyst estimates among its peers. The stock is down 5.9% since reporting and currently trades at $53.20.
Read our full, actionable report on American Woodmark here, it’s free.
Market Update
The Fed’s interest rate hikes throughout 2022 and 2023 have successfully cooled post-pandemic inflation, bringing it closer to the 2% target. Inflationary pressures have eased without tipping the economy into a recession, suggesting a soft landing. This stability, paired with recent rate cuts (0.5% in September 2024 and 0.25% in November 2024), fueled a strong year for the stock market in 2024. The markets surged further after Donald Trump’s presidential victory in November, with major indices reaching record highs in the days following the election. Still, questions remain about the direction of economic policy, as potential tariffs and corporate tax changes add uncertainty for 2025.
Want to invest in winners with rock-solid fundamentals? Check out our Top 5 Growth Stocks and add them to your watchlist. These companies are poised for growth regardless of the political or macroeconomic climate.