Over the past six months, Powell’s stock price fell to $214.30. Shareholders have lost 5.6% of their capital, which is disappointing considering the S&P 500 has climbed by 4.5%. This might have investors contemplating their next move.
Following the drawdown, is this a buying opportunity for POWL? Find out in our full research report, it’s free.
Why Does POWL Stock Spark Debate?
Originally a metal-working shop supporting local petrochemical facilities, Powell (NYSE: POWL) has grown from a small Houston manufacturer to a global provider of electrical systems.
Two Things to Like:
1. Skyrocketing Revenue Shows Strong Momentum
A company’s long-term sales performance can indicate its overall quality. Any business can have short-term success, but a top-tier one grows for years. Over the last five years, Powell grew its sales at an exceptional 13.7% compounded annual growth rate. Its growth beat the average industrials company and shows its offerings resonate with customers. 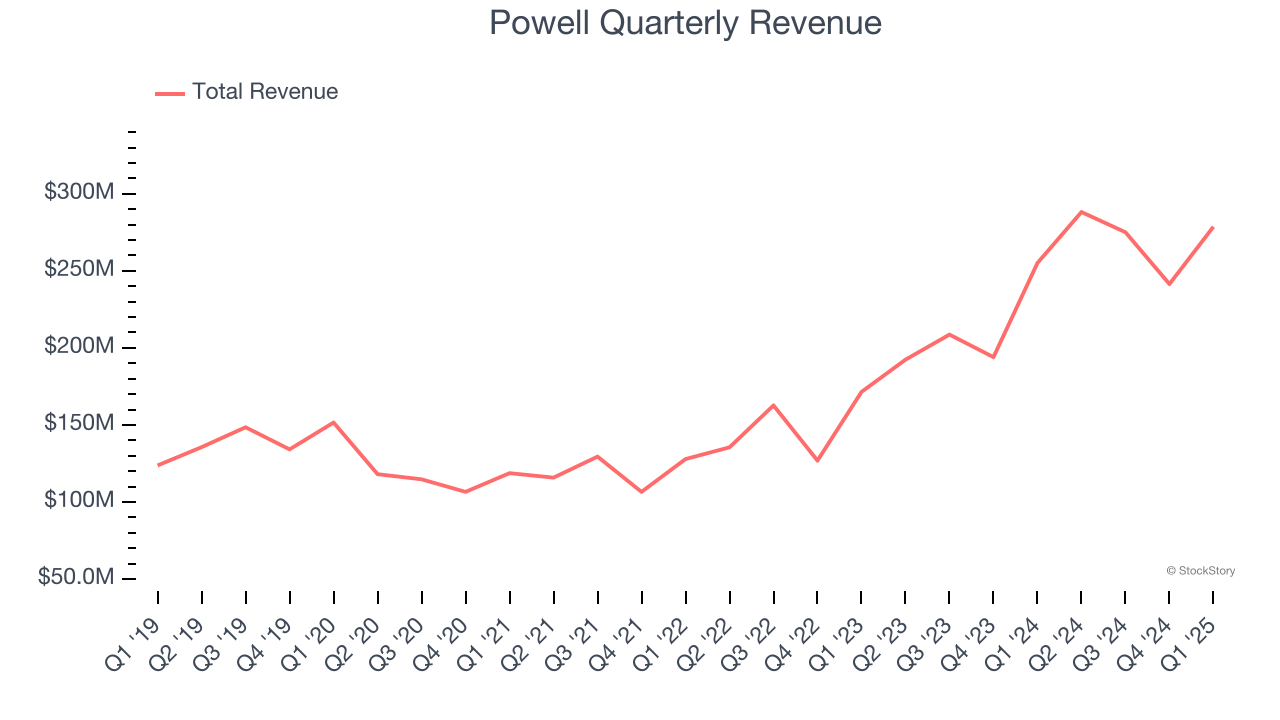
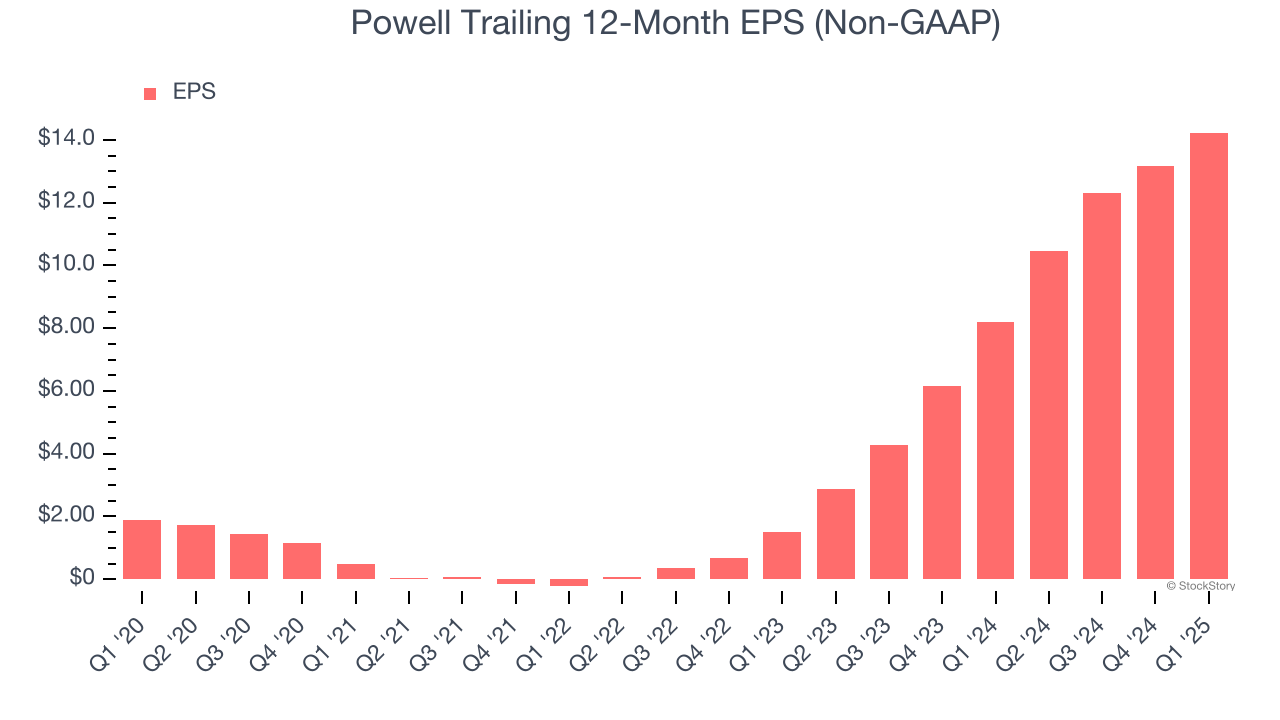
2. Outstanding Long-Term EPS Growth
We track the long-term change in earnings per share (EPS) because it highlights whether a company’s growth is profitable.
Powell’s EPS grew at an astounding 49.9% compounded annual growth rate over the last five years, higher than its 13.7% annualized revenue growth. This tells us the company became more profitable on a per-share basis as it expanded.
One Reason to be Careful:
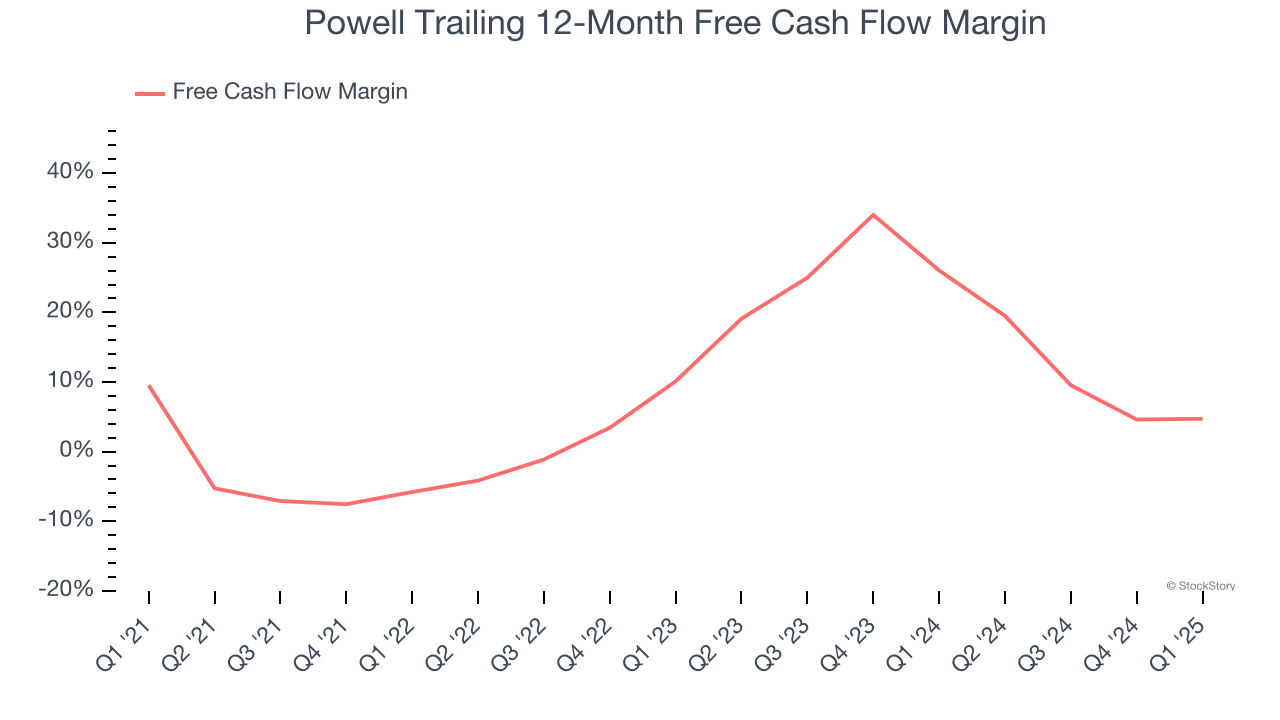
Free Cash Flow Margin Dropping
Free cash flow isn't a prominently featured metric in company financials and earnings releases, but we think it's telling because it accounts for all operating and capital expenses, making it tough to manipulate. Cash is king.
As you can see below, Powell’s margin dropped by 4.8 percentage points over the last five years. If its declines continue, it could signal increasing investment needs and capital intensity. Powell’s free cash flow margin for the trailing 12 months was 4.7%.
Final Judgment
Powell’s positive characteristics outweigh the negatives. With the recent decline, the stock trades at 14.4× forward P/E (or $214.30 per share). Is now the time to initiate a position? See for yourself in our full research report, it’s free.
High-Quality Stocks for All Market Conditions
Donald Trump’s victory in the 2024 U.S. Presidential Election sent major indices to all-time highs, but stocks have retraced as investors debate the health of the economy and the potential impact of tariffs.
While this leaves much uncertainty around 2025, a few companies are poised for long-term gains regardless of the political or macroeconomic climate, like our Top 5 Growth Stocks for this month. This is a curated list of our High Quality stocks that have generated a market-beating return of 183% over the last five years (as of March 31st 2025).
Stocks that made our list in 2020 include now familiar names such as Nvidia (+1,545% between March 2020 and March 2025) as well as under-the-radar businesses like the once-micro-cap company Kadant (+351% five-year return). Find your next big winner with StockStory today.