Earnings results often indicate what direction a company will take in the months ahead. With Q1 behind us, let’s have a look at Yext (NYSE: YEXT) and its peers.
The Internet and the exploding amount of data have transformed how businesses interact with, market to, and transact with their customers. Personalization of offerings, e-commerce, targeted advertising and data-empowered sales teams are now table stakes for modern businesses, and sales and marketing software providers are becoming the tools of evolving customer interaction.
The 23 sales and marketing software stocks we track reported a satisfactory Q1. As a group, revenues beat analysts’ consensus estimates by 2.5% while next quarter’s revenue guidance was in line.
In light of this news, share prices of the companies have held steady. On average, they are relatively unchanged since the latest earnings results.
Best Q1: Yext (NYSE: YEXT)
Founded in 2006 by Howard Lerman, Yext (NYSE: YEXT) offers software as a service that helps their clients manage and monitor their online listings and customer reviews across all relevant databases, from Google Maps to Alexa or Siri.
Yext reported revenues of $109.5 million, up 14.1% year on year. This print exceeded analysts’ expectations by 1.8%. Overall, it was an exceptional quarter for the company with a solid beat of analysts’ annual recurring revenue estimates and an impressive beat of analysts’ billings estimates.
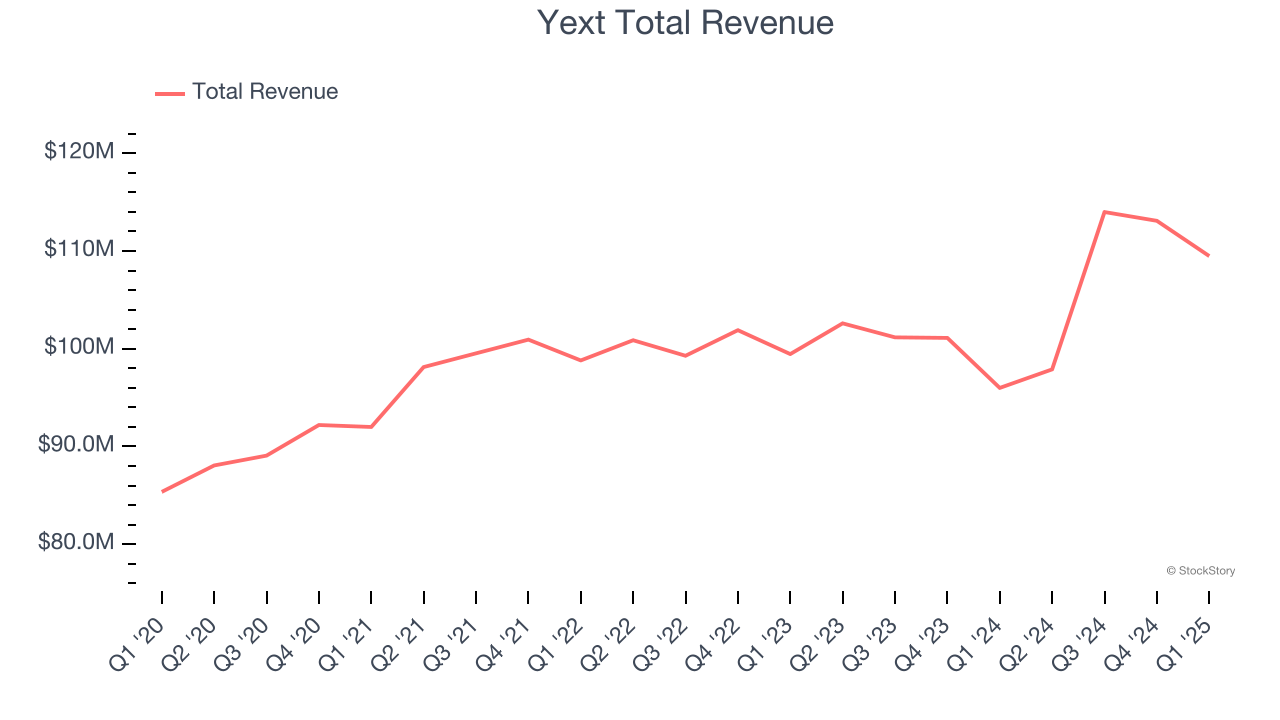
Interestingly, the stock is up 24.8% since reporting and currently trades at $8.50.
Is now the time to buy Yext? Access our full analysis of the earnings results here, it’s free.
The Trade Desk (NASDAQ: TTD)
Founded by former Microsoft engineers Jeff Green and Dave Pickles, The Trade Desk (NASDAQ: TTD) offers cloud-based software that uses data to help advertisers better plan, place, and target their online ads.
The Trade Desk reported revenues of $616 million, up 25.4% year on year, outperforming analysts’ expectations by 7%. The business had a very strong quarter with a solid beat of analysts’ EBITDA estimates and an impressive beat of analysts’ billings estimates.

The market seems happy with the results as the stock is up 15.8% since reporting. It currently trades at $69.48.
Is now the time to buy The Trade Desk? Access our full analysis of the earnings results here, it’s free.
Weakest Q1: Braze (NASDAQ: BRZE)
Founded in 2011 after the co-founders met at NYC Disrupt Hackathon, Braze (NASDAQ: BRZE) is a customer engagement software platform that allows brands to connect with customers through data-driven and contextual marketing campaigns.
Braze reported revenues of $162.1 million, up 19.6% year on year, exceeding analysts’ expectations by 2.2%. Still, it was a slower quarter as it posted full-year EPS guidance missing analysts’ expectations significantly and EPS guidance for next quarter missing analysts’ expectations significantly.
As expected, the stock is down 26% since the results and currently trades at $26.75.
Read our full analysis of Braze’s results here.
Semrush (NYSE: SEMR)
Started by Oleg Shchegolev while still in university, Semrush (NYSE: SEMR) is a software-as-a-service platform that helps companies optimize their search engine and content marketing efforts.
Semrush reported revenues of $105 million, up 22.4% year on year. This print surpassed analysts’ expectations by 0.9%. It was a strong quarter as it also put up a solid beat of analysts’ EBITDA estimates and an impressive beat of analysts’ billings estimates.
The company added 1,000 customers to reach a total of 118,000. The stock is down 12.3% since reporting and currently trades at $8.92.
Read our full, actionable report on Semrush here, it’s free.
Sprinklr (NYSE: CXM)
Initially focused only on social media management, Sprinklr (NYSE: CXM) is a leading provider of unified customer experience management software.
Sprinklr reported revenues of $205.5 million, up 4.9% year on year. This number beat analysts’ expectations by 1.8%. Overall, it was a very strong quarter as it also logged a solid beat of analysts’ EBITDA estimates and full-year EPS guidance exceeding analysts’ expectations.
The stock is down 4% since reporting and currently trades at $8.21.
Read our full, actionable report on Sprinklr here, it’s free.
Market Update
As a result of the Fed’s rate hikes in 2022 and 2023, inflation has come down from frothy levels post-pandemic. The general rise in the price of goods and services is trending towards the Fed’s 2% goal as of late, which is good news. The higher rates that fought inflation also didn't slow economic activity enough to catalyze a recession. So far, soft landing. This, combined with recent rate cuts (half a percent in September 2024 and a quarter percent in November 2024) have led to strong stock market performance in 2024. The icing on the cake for 2024 returns was Donald Trump’s victory in the U.S. Presidential Election in early November, sending major indices to all-time highs in the week following the election. Still, debates around the health of the economy and the impact of potential tariffs and corporate tax cuts remain, leaving much uncertainty around 2025.
Want to invest in winners with rock-solid fundamentals? Check out our Top 5 Growth Stocks and add them to your watchlist. These companies are poised for growth regardless of the political or macroeconomic climate.