Since June 2020, the S&P 500 has delivered a total return of 91.4%. But one standout stock has nearly doubled the market - over the past five years, HEICO has surged 167% to $296.08 per share. Its momentum hasn’t stopped as it’s also gained 9.7% in the last six months thanks to its solid quarterly results, beating the S&P by 11.6%.
Is it too late to buy HEI? Find out in our full research report, it’s free.
Why Are We Positive On HEI?
Founded in 1957, HEICO (NYSE: HEI) manufactures and services aerospace and electronic components for commercial aviation, defense, space, and other industries.
1. Organic Growth Indicates Solid Core Business
In addition to reported revenue, organic revenue is a useful data point for analyzing Aerospace companies. This metric gives visibility into HEICO’s core business because it excludes one-time events such as mergers, acquisitions, and divestitures along with foreign currency fluctuations - non-fundamental factors that can manipulate the income statement.
Over the last two years, HEICO’s organic revenue averaged 9.6% year-on-year growth. This performance was solid and shows it can expand steadily without relying on expensive (and risky) acquisitions. 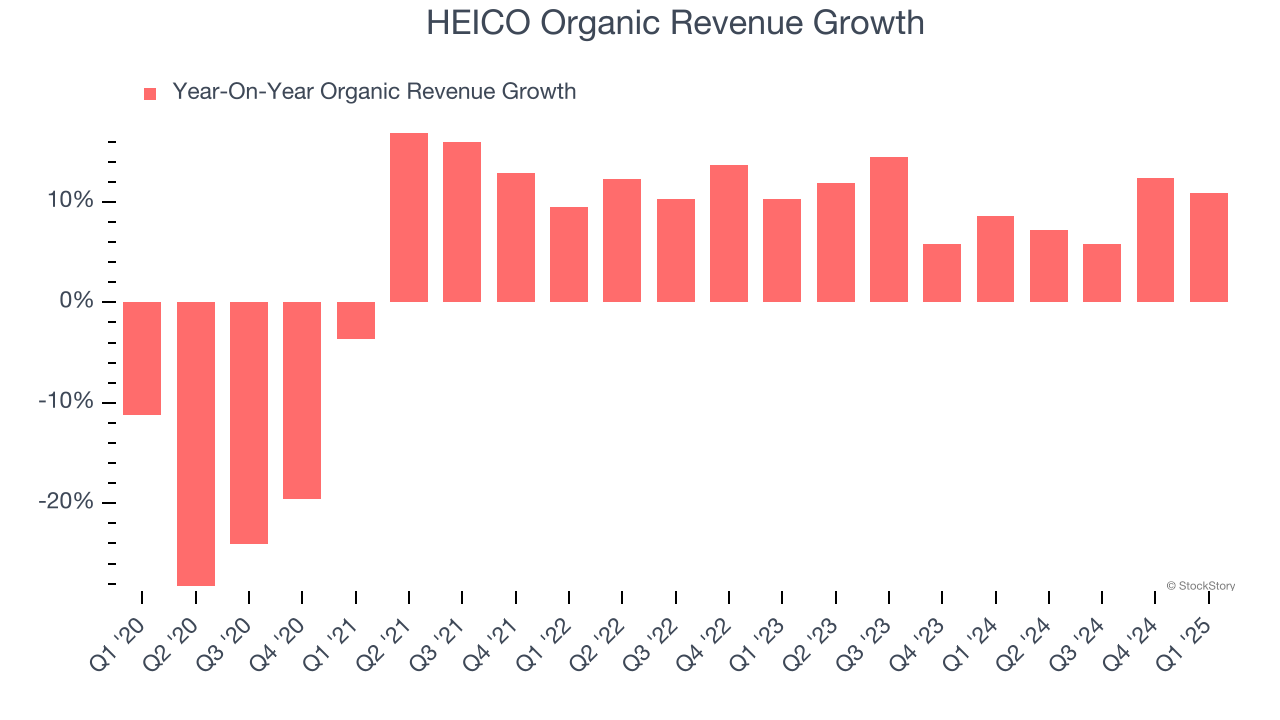
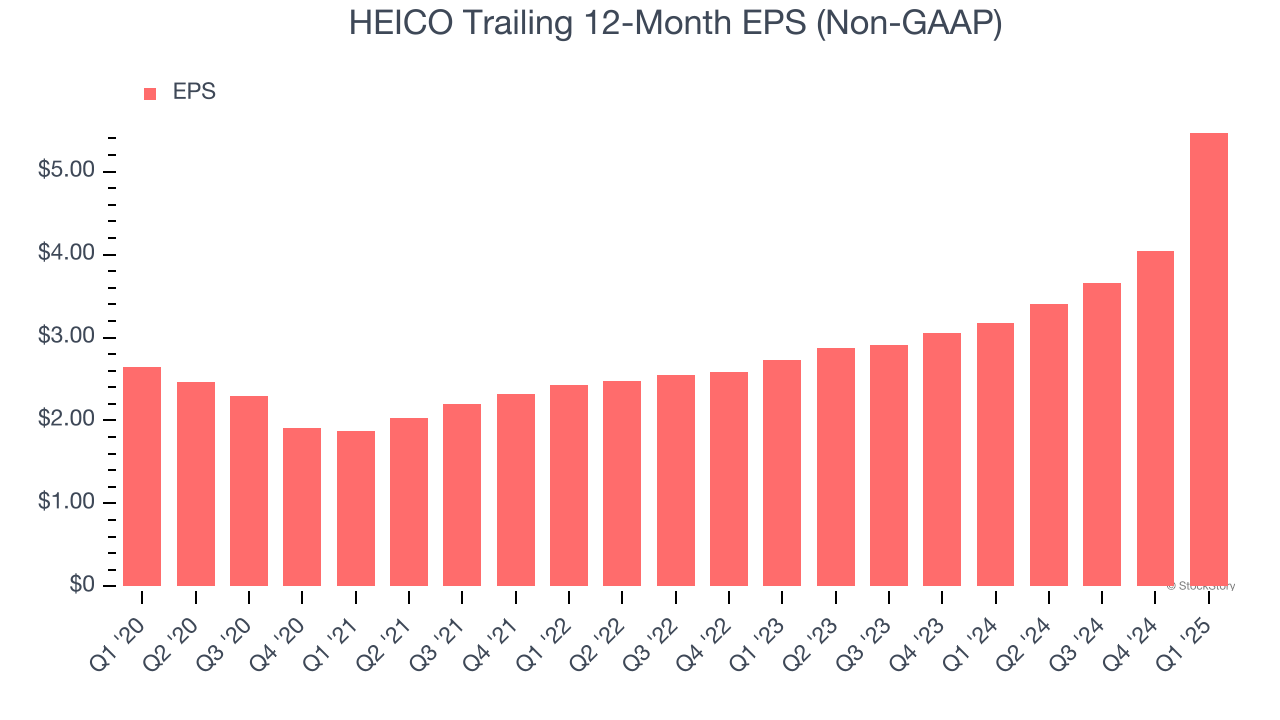
2. Outstanding Long-Term EPS Growth
Analyzing the long-term change in earnings per share (EPS) shows whether a company's incremental sales were profitable – for example, revenue could be inflated through excessive spending on advertising and promotions.
HEICO’s spectacular 15.6% annual EPS growth over the last five years aligns with its revenue performance. This tells us its incremental sales were profitable.
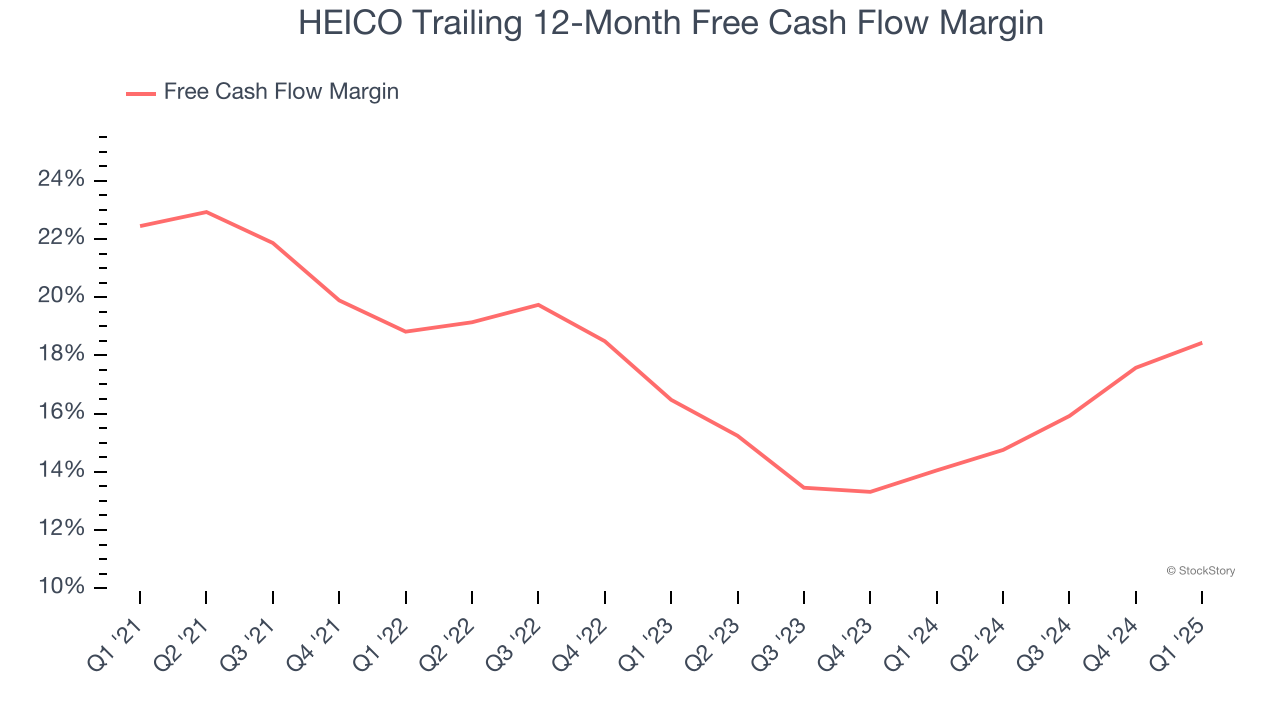
3. Excellent Free Cash Flow Margin Boosts Reinvestment Potential
Free cash flow isn't a prominently featured metric in company financials and earnings releases, but we think it's telling because it accounts for all operating and capital expenses, making it tough to manipulate. Cash is king.
HEICO has shown terrific cash profitability, putting it in an advantageous position to invest in new products, return capital to investors, and consolidate the market during industry downturns. The company’s free cash flow margin was among the best in the industrials sector, averaging 17.5% over the last five years.
Final Judgment
These are just a few reasons HEICO is a rock-solid business worth owning, and with its shares topping the market in recent months, the stock trades at 64.1× forward P/E (or $296.08 per share). Is now the right time to buy? See for yourself in our in-depth research report, it’s free.
High-Quality Stocks for All Market Conditions
The market surged in 2024 and reached record highs after Donald Trump’s presidential victory in November, but questions about new economic policies are adding much uncertainty for 2025.
While the crowd speculates what might happen next, we’re homing in on the companies that can succeed regardless of the political or macroeconomic environment. Put yourself in the driver’s seat and build a durable portfolio by checking out our Top 5 Growth Stocks for this month. This is a curated list of our High Quality stocks that have generated a market-beating return of 183% over the last five years (as of March 31st 2025).
Stocks that made our list in 2020 include now familiar names such as Nvidia (+1,545% between March 2020 and March 2025) as well as under-the-radar businesses like the once-small-cap company Comfort Systems (+782% five-year return). Find your next big winner with StockStory today.