As the craze of earnings season draws to a close, here’s a look back at some of the most exciting (and some less so) results from Q1. Today, we are looking at broadcasting stocks, starting with E.W. Scripps (NASDAQ: SSP).
Broadcasting companies have been facing secular headwinds in the form of consumers abandoning traditional television and radio in favor of streaming services. As a result, many broadcasting companies have evolved by forming distribution agreements with major streaming platforms so they can get in on part of the action, but will these subscription revenues be as high quality and high margin as their legacy revenues? Only time will tell which of these broadcasters will survive the sea changes of technological advancement and fragmenting consumer attention.
The 7 broadcasting stocks we track reported a strong Q1. As a group, revenues beat analysts’ consensus estimates by 1.1% while next quarter’s revenue guidance was 0.6% below.
In light of this news, share prices of the companies have held steady as they are up 4.6% on average since the latest earnings results.
E.W. Scripps (NASDAQ: SSP)
Founded as a chain of daily newspapers, E.W. Scripps (NASDAQ: SSP) is a diversified media enterprise operating a range of local television stations, national networks, and digital media platforms.
E.W. Scripps reported revenues of $524.4 million, down 6.6% year on year. This print exceeded analysts’ expectations by 0.7%. Overall, it was a very strong quarter for the company with a solid beat of analysts’ EBITDA estimates.
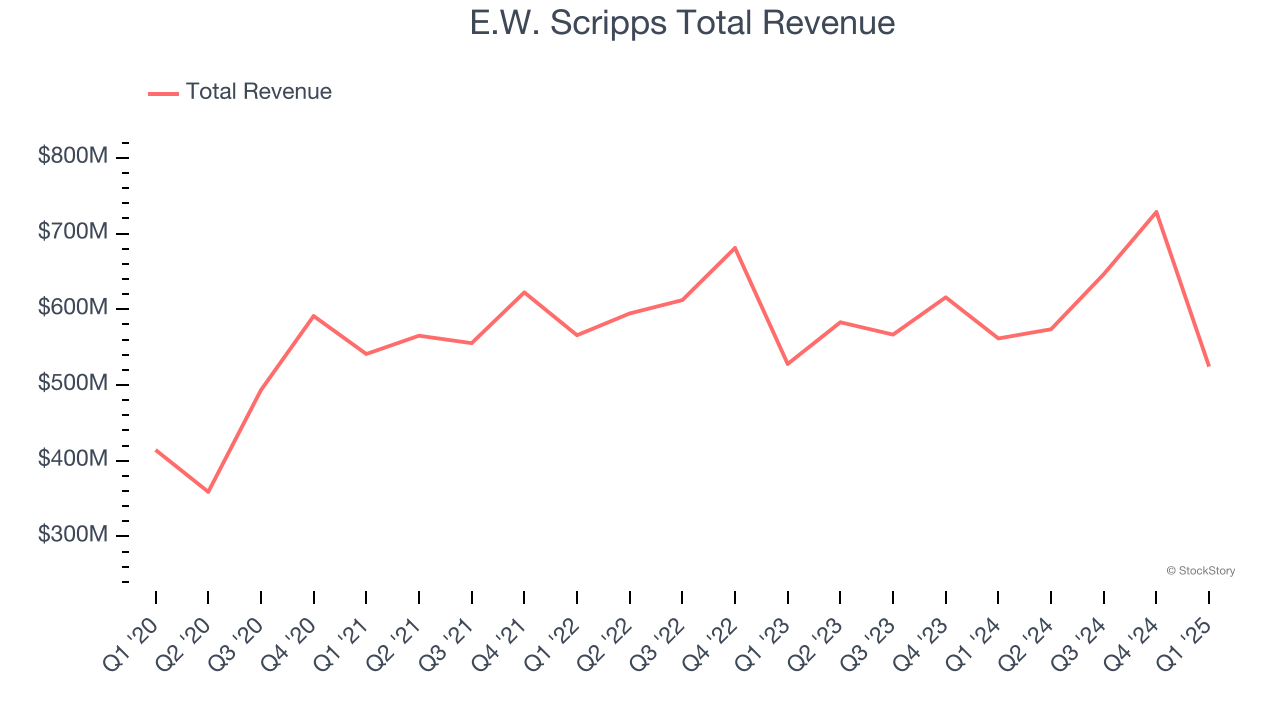
The stock is down 8.7% since reporting and currently trades at $2.35.
Is now the time to buy E.W. Scripps? Access our full analysis of the earnings results here, it’s free.
Best Q1: FOX (NASDAQ: FOXA)
Founded in 1915, Fox (NASDAQ: FOXA) is a diversified media company, operating prominent cable news, television broadcasting, and digital media platforms.
FOX reported revenues of $4.37 billion, up 26.8% year on year, outperforming analysts’ expectations by 4.3%. The business had an exceptional quarter with a solid beat of analysts’ adjusted operating income estimates and an impressive beat of analysts’ EPS estimates.
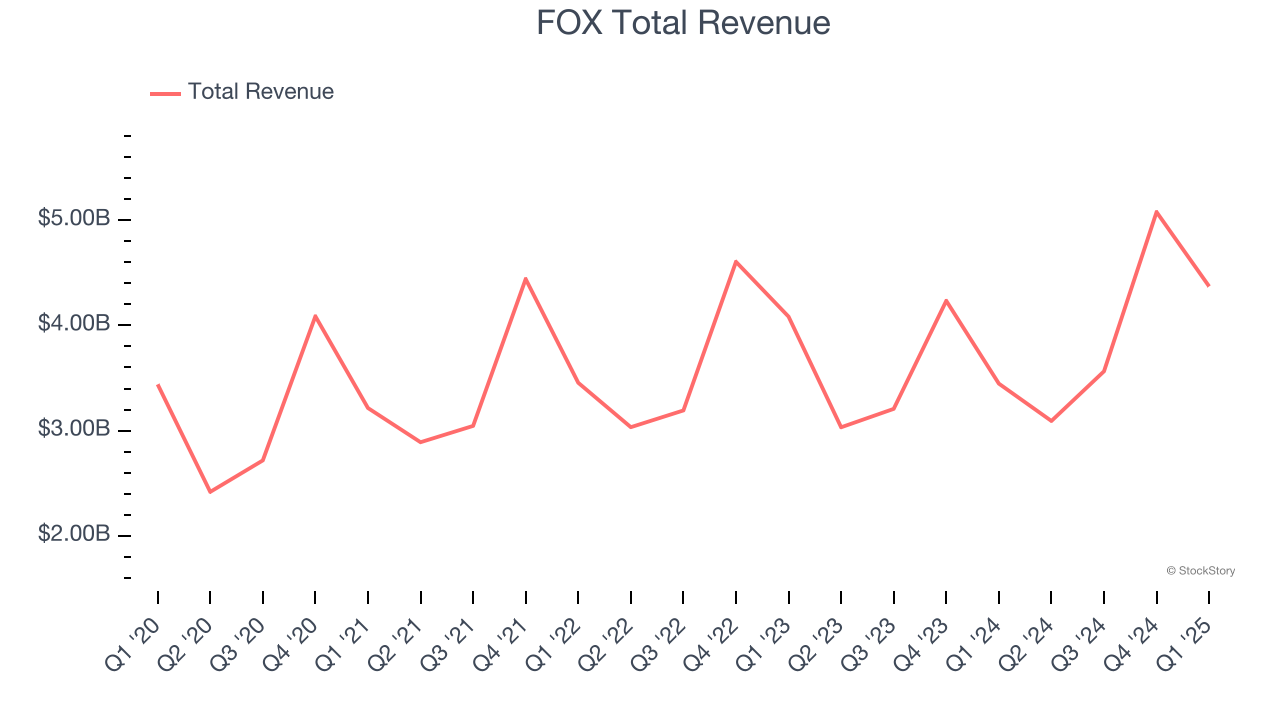
FOX scored the biggest analyst estimates beat and fastest revenue growth among its peers. The market seems happy with the results as the stock is up 9.9% since reporting. It currently trades at $55.27.
Is now the time to buy FOX? Access our full analysis of the earnings results here, it’s free.
Weakest Q1: iHeartMedia (NASDAQ: IHRT)
Occasionally featuring celebrity hosts like Ryan Seacrest on its shows, iHeartMedia (NASDAQ: IHRT) is a leading multimedia company renowned for its extensive network of radio stations, digital platforms, and live events across the globe.
iHeartMedia reported revenues of $807.1 million, up 1% year on year, exceeding analysts’ expectations by 2.6%. Still, it was a slower quarter as it posted a significant miss of analysts’ adjusted operating income and EPS estimates.
Interestingly, the stock is up 11.8% since the results and currently trades at $1.42.
Read our full analysis of iHeartMedia’s results here.
AMC Networks (NASDAQ: AMCX)
Originally the joint-venture of four cable television companies, AMC Networks (NASDAQ: AMCX) is a broadcaster producing a diverse range of television shows and movies.
AMC Networks reported revenues of $555.2 million, down 6.9% year on year. This print missed analysts’ expectations by 2.6%. It was a slower quarter as it also produced a significant miss of analysts’ EPS estimates and a miss of analysts’ Affiliate revenue estimates.
AMC Networks had the weakest performance against analyst estimates and slowest revenue growth among its peers. The stock is up 7.3% since reporting and currently trades at $6.64.
Read our full, actionable report on AMC Networks here, it’s free.
TEGNA (NYSE: TGNA)
Spun out of Gannett in 2015, TEGNA (NYSE: TGNA) is a media company operating a network of television stations and digital platforms, focusing on local news and community content.
TEGNA reported revenues of $680 million, down 4.8% year on year. This number met analysts’ expectations. Zooming out, it was a satisfactory quarter as it also recorded a solid beat of analysts’ EPS estimates.
The stock is flat since reporting and currently trades at $16.66.
Read our full, actionable report on TEGNA here, it’s free.
Market Update
As a result of the Fed’s rate hikes in 2022 and 2023, inflation has come down from frothy levels post-pandemic. The general rise in the price of goods and services is trending towards the Fed’s 2% goal as of late, which is good news. The higher rates that fought inflation also didn't slow economic activity enough to catalyze a recession. So far, soft landing. This, combined with recent rate cuts (half a percent in September 2024 and a quarter percent in November 2024) have led to strong stock market performance in 2024. The icing on the cake for 2024 returns was Donald Trump’s victory in the U.S. Presidential Election in early November, sending major indices to all-time highs in the week following the election. Still, debates around the health of the economy and the impact of potential tariffs and corporate tax cuts remain, leaving much uncertainty around 2025.
Want to invest in winners with rock-solid fundamentals? Check out our Top 5 Growth Stocks and add them to your watchlist. These companies are poised for growth regardless of the political or macroeconomic climate.