Industrial supplies company MSC Industrial Direct (NYSE: MSM) met Wall Street’s revenue expectations in Q2 CY2025, but sales were flat year on year at $971.1 million. Its non-GAAP profit of $1.08 per share was 5.1% above analysts’ consensus estimates.
Is now the time to buy MSC Industrial? Find out by accessing our full research report, it’s free.
MSC Industrial (MSM) Q2 CY2025 Highlights:
- Revenue: $971.1 million vs analyst estimates of $968.5 million (flat year on year, in line)
- Adjusted EPS: $1.08 vs analyst estimates of $1.03 (5.1% beat)
- Adjusted EBITDA: $108.8 million vs analyst estimates of $106.6 million (11.2% margin, 2% beat)
- Operating Margin: 8.5%, down from 10.9% in the same quarter last year
- Free Cash Flow Margin: 7.8%, down from 11.6% in the same quarter last year
- Market Capitalization: $4.74 billion
Erik Gershwind, Chief Executive Officer, said, "We delivered fiscal third quarter results that were in line with our expectations for both average daily sales and operating margins. While we certainly have plenty of room for improvement, we saw early signs of progress in each of our three critical strategic areas of focus — reenergizing the core customer, maintaining momentum in high-touch solutions, and optimizing our cost to serve."
Company Overview
Founded in NYC’s Little Italy, MSC Industrial Direct (NYSE: MSM) provides industrial supplies and equipment, offering vast and reliable selection for customers such as contractors
Revenue Growth
A company’s long-term sales performance can indicate its overall quality. Even a bad business can shine for one or two quarters, but a top-tier one grows for years. Unfortunately, MSC Industrial’s 2.6% annualized revenue growth over the last five years was sluggish. This fell short of our benchmarks and is a rough starting point for our analysis.

We at StockStory place the most emphasis on long-term growth, but within industrials, a half-decade historical view may miss cycles, industry trends, or a company capitalizing on catalysts such as a new contract win or a successful product line. MSC Industrial’s performance shows it grew in the past but relinquished its gains over the last two years, as its revenue fell by 3.2% annually. MSC Industrial isn’t alone in its struggles as the Maintenance and Repair Distributors industry experienced a cyclical downturn, with many similar businesses observing lower sales at this time. 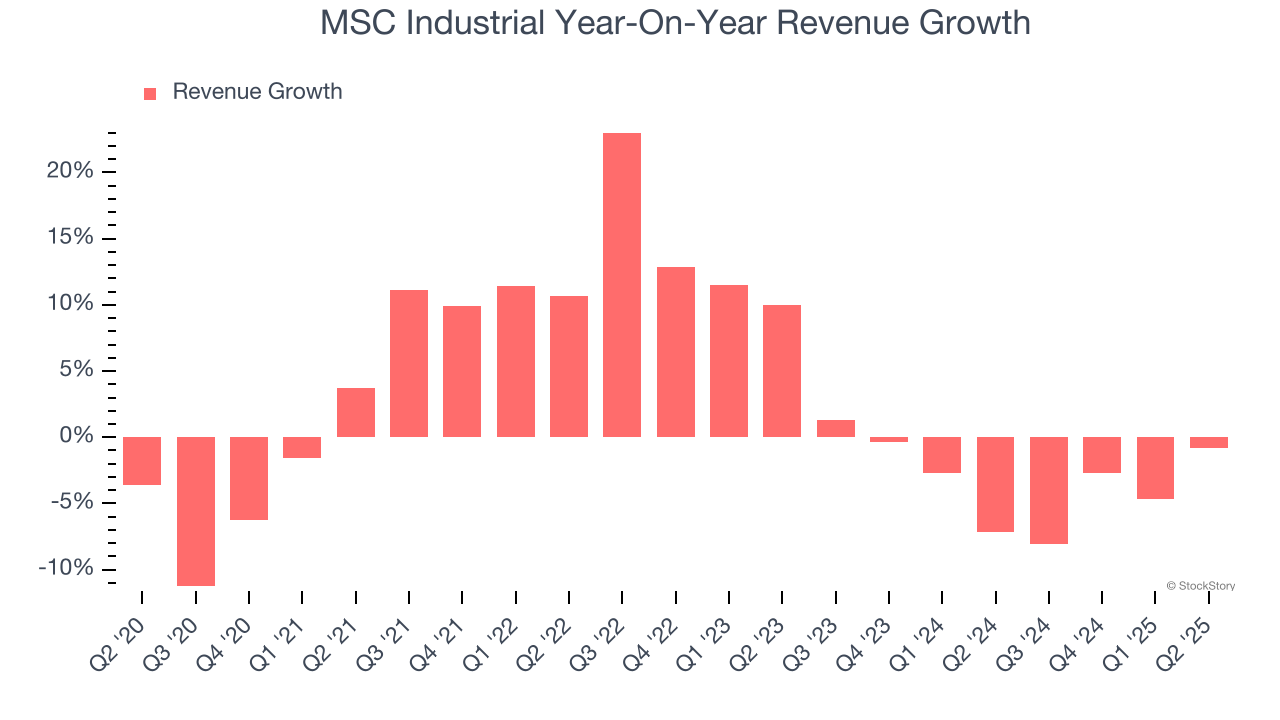
This quarter, MSC Industrial’s $971.1 million of revenue was flat year on year and in line with Wall Street’s estimates.
Looking ahead, sell-side analysts expect revenue to grow 2.1% over the next 12 months. While this projection indicates its newer products and services will fuel better top-line performance, it is still below the sector average.
Software is eating the world and there is virtually no industry left that has been untouched by it. That drives increasing demand for tools helping software developers do their jobs, whether it be monitoring critical cloud infrastructure, integrating audio and video functionality, or ensuring smooth content streaming. Click here to access a free report on our 3 favorite stocks to play this generational megatrend.
Operating Margin
MSC Industrial’s operating margin might fluctuated slightly over the last 12 months but has remained more or less the same, averaging 10.6% over the last five years. This profitability was solid for an industrials business and shows it’s an efficient company that manages its expenses well. This result isn’t surprising as its high gross margin gives it a favorable starting point.
Looking at the trend in its profitability, MSC Industrial’s operating margin might fluctuated slightly but has generally stayed the same over the last five years. This raises questions about the company’s expense base because its revenue growth should have given it leverage on its fixed costs, resulting in better economies of scale and profitability.
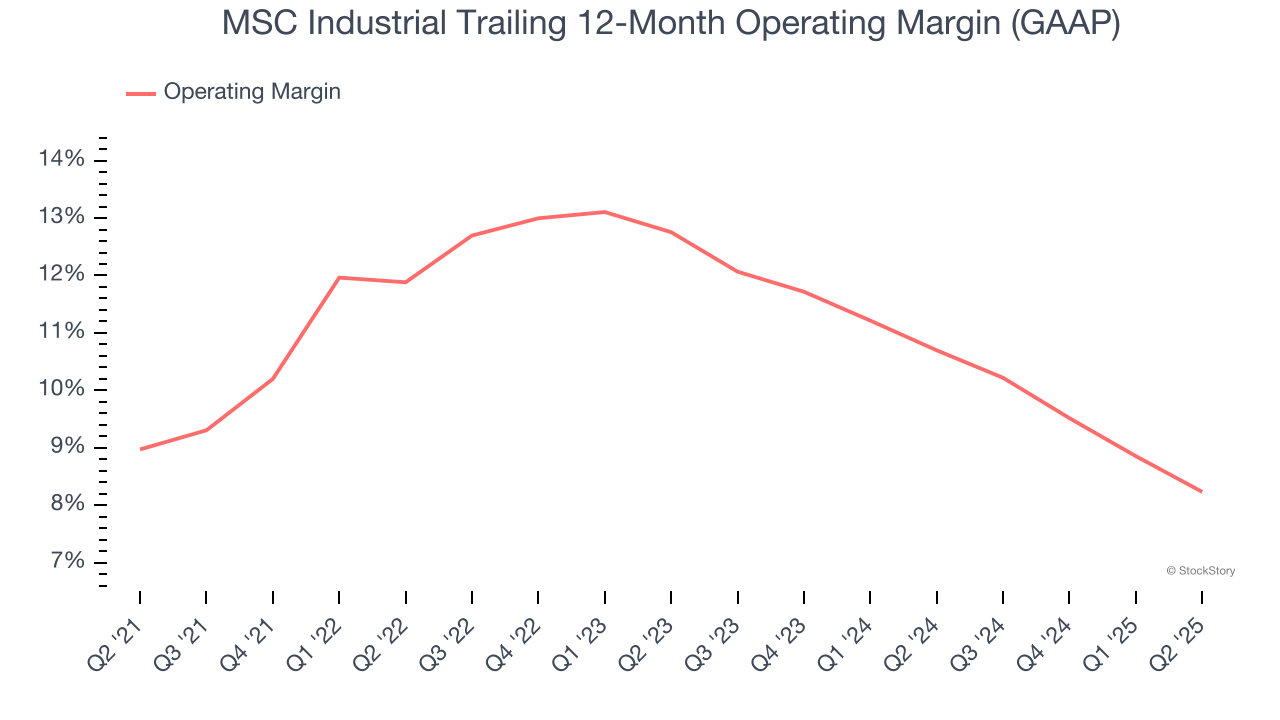
In Q2, MSC Industrial generated an operating margin profit margin of 8.5%, down 2.4 percentage points year on year. Since MSC Industrial’s operating margin decreased more than its gross margin, we can assume it was less efficient because expenses such as marketing, R&D, and administrative overhead increased.
Earnings Per Share
We track the long-term change in earnings per share (EPS) for the same reason as long-term revenue growth. Compared to revenue, however, EPS highlights whether a company’s growth is profitable.
Sadly for MSC Industrial, its EPS declined by 5.6% annually over the last five years while its revenue grew by 2.6%. However, its operating margin didn’t change during this time, telling us that non-fundamental factors such as interest and taxes affected its ultimate earnings.
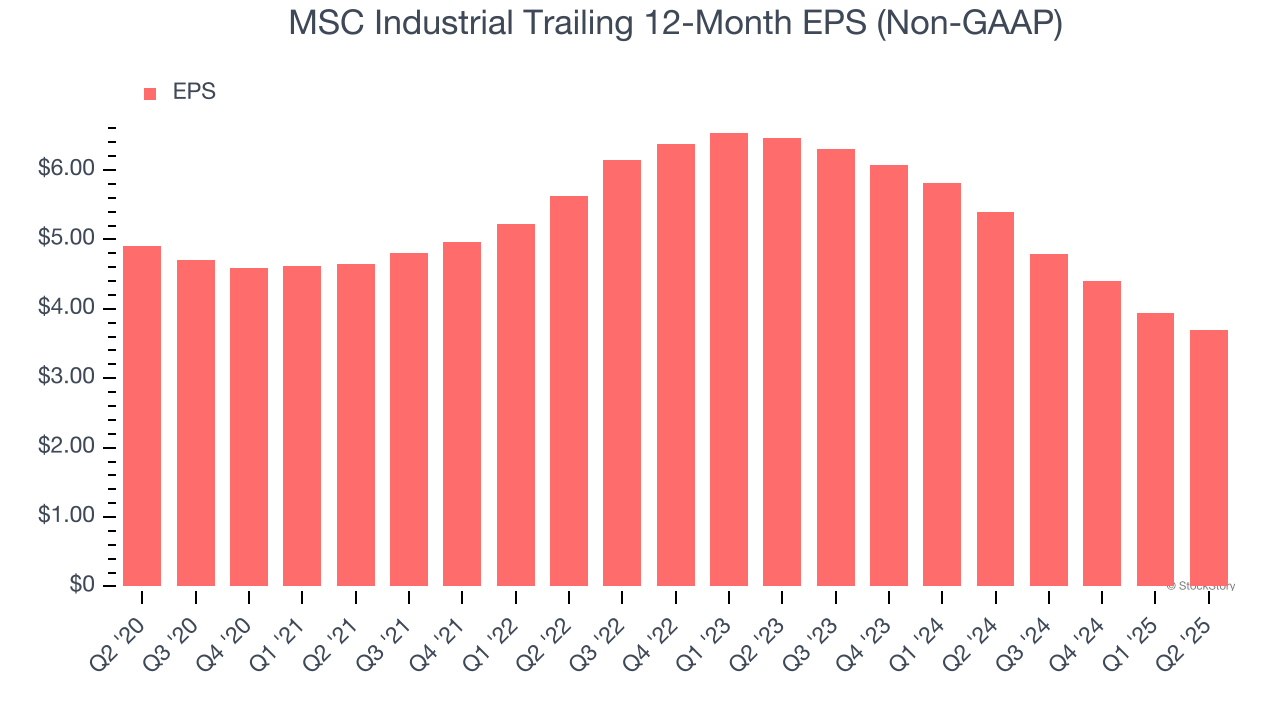
Like with revenue, we analyze EPS over a shorter period to see if we are missing a change in the business.
For MSC Industrial, its two-year annual EPS declines of 24.4% show it’s continued to underperform. These results were bad no matter how you slice the data.
In Q2, MSC Industrial reported EPS at $1.08, down from $1.33 in the same quarter last year. Despite falling year on year, this print beat analysts’ estimates by 5.1%. Over the next 12 months, Wall Street expects MSC Industrial’s full-year EPS of $3.69 to grow 2.9%.
Key Takeaways from MSC Industrial’s Q2 Results
It was encouraging to see MSC Industrial beat analysts’ EBITDA and EPS expectations this quarter despite in line revenue. In the quarter, management saw "encouraging data points, such as core customer sequential improvement, continued momentum in our high-touch solutions and a building productivity pipeline." Overall, this print had some key positives. The stock traded up 4.7% to $88.95 immediately after reporting.
Is MSC Industrial an attractive investment opportunity at the current price? If you’re making that decision, you should consider the bigger picture of valuation, business qualities, as well as the latest earnings. We cover that in our actionable full research report which you can read here, it’s free.