
Quarterly earnings results are a good time to check in on a company’s progress, especially compared to its peers in the same sector. Today we are looking at Warner Music Group (NASDAQ: WMG) and the best and worst performers in the media industry.
The advent of the internet changed how shows, films, music, and overall information flow. As a result, many media companies now face secular headwinds as attention shifts online. Some have made concerted efforts to adapt by introducing digital subscriptions, podcasts, and streaming platforms. Time will tell if their strategies succeed and which companies will emerge as the long-term winners.
The 7 media stocks we track reported a satisfactory Q1. As a group, revenues missed analysts’ consensus estimates by 5.3%.
Luckily, media stocks have performed well with share prices up 16.3% on average since the latest earnings results.
Weakest Q1: Warner Music Group (NASDAQ: WMG)
Launching the careers of legendary artists like Frank Sinatra, Warner Music Group (NASDAQ: WMG) is a music company managing a diverse portfolio of artists, recordings, and music publishing services worldwide.
Warner Music Group reported revenues of $1.48 billion, flat year on year. This print fell short of analysts’ expectations by 2.2%. Overall, it was a softer quarter for the company with a significant miss of analysts’ EPS estimates and a miss of analysts’ Recorded Music revenue estimates.
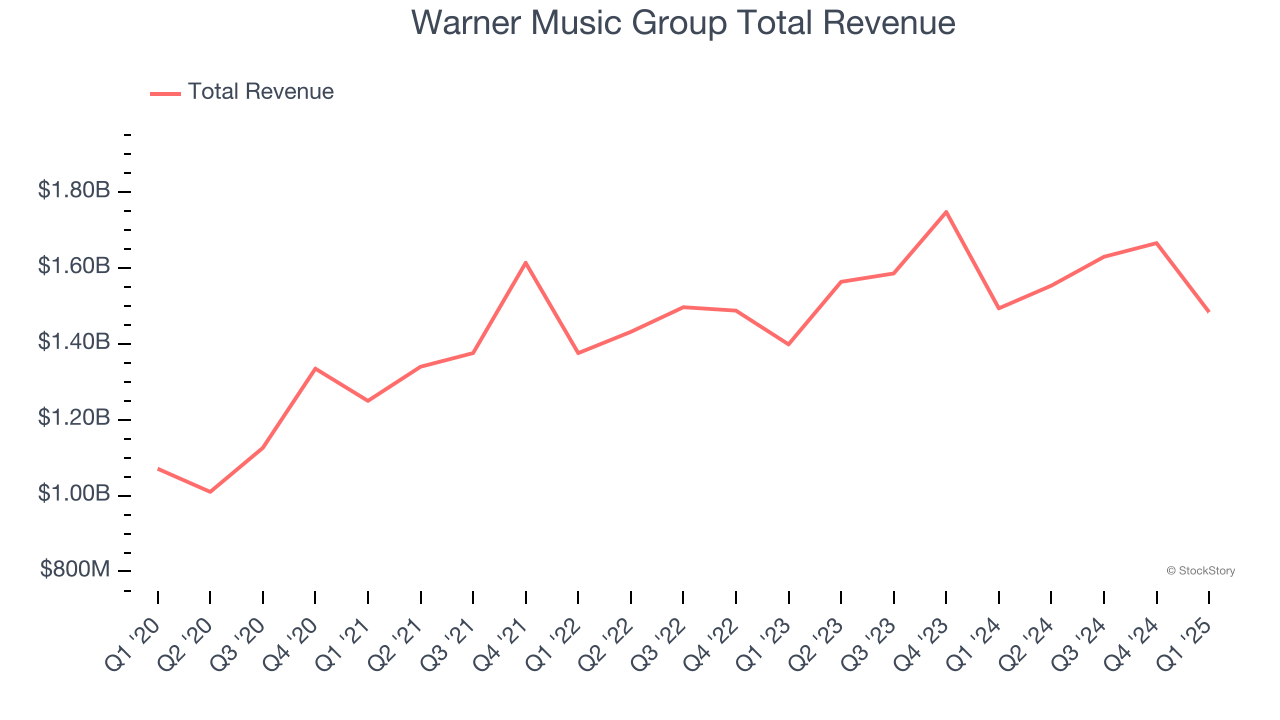
Unsurprisingly, the stock is down 9.2% since reporting and currently trades at $27.32.
Read our full report on Warner Music Group here, it’s free.
Best Q1: Disney (NYSE: DIS)
Founded by brothers Walt and Roy, Disney (NYSE: DIS) is a multinational entertainment conglomerate, renowned for its theme parks, movies, television networks, and merchandise.
Disney reported revenues of $23.62 billion, up 7% year on year, outperforming analysts’ expectations by 2%. The business had a very strong quarter with an impressive beat of analysts’ adjusted operating income estimates and a solid beat of analysts’ EPS estimates.
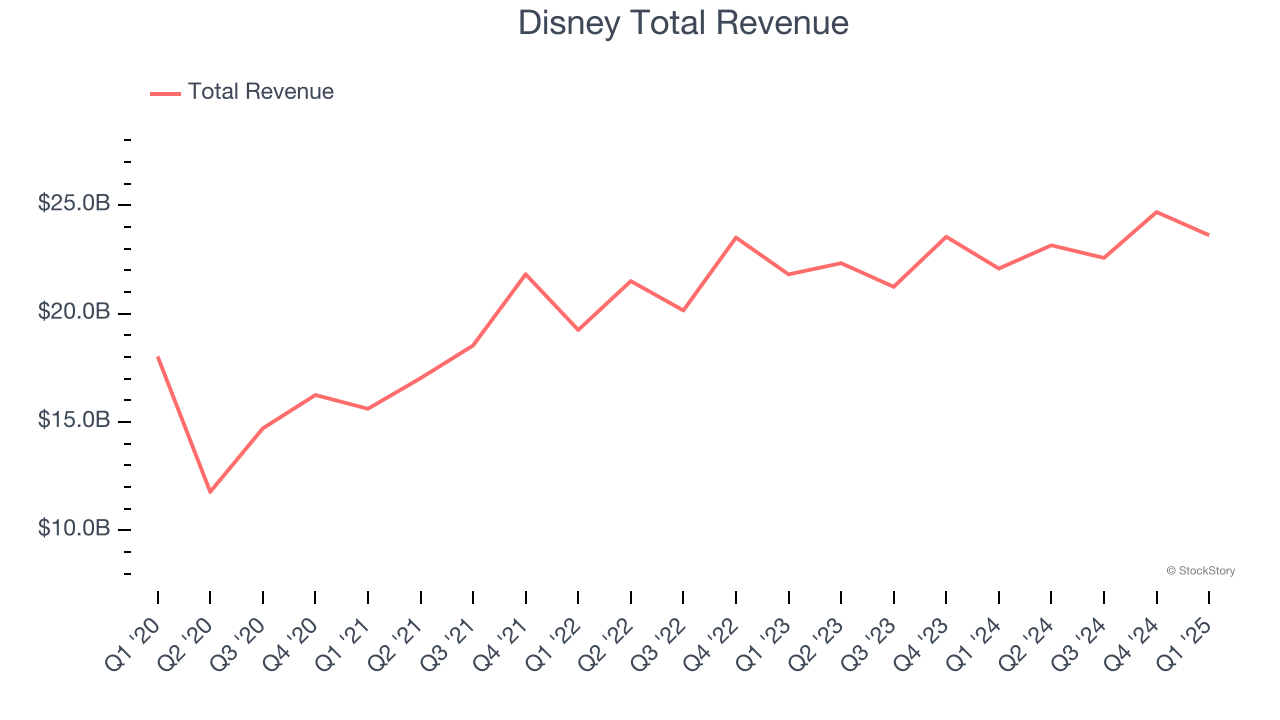
Disney pulled off the biggest analyst estimates beat among its peers. The market seems happy with the results as the stock is up 34.6% since reporting. It currently trades at $123.95.
Is now the time to buy Disney? Access our full analysis of the earnings results here, it’s free.
Warner Bros. Discovery (NASDAQ: WBD)
Formed from the merger of WarnerMedia and Discovery, Warner Bros. Discovery (NASDAQ: WBD) is a multinational media and entertainment company, offering television networks, streaming services, and film and television production.
Warner Bros. Discovery reported revenues of $8.98 billion, down 9.8% year on year, falling short of analysts’ expectations by 6%. It was a slower quarter as it posted a significant miss of analysts’ adjusted operating income estimates and a miss of analysts’ Advertising revenue estimates.
Warner Bros. Discovery delivered the slowest revenue growth in the group. Interestingly, the stock is up 30.2% since the results and currently trades at $11.18.
Read our full analysis of Warner Bros. Discovery’s results here.
Scholastic (NASDAQ: SCHL)
Creator of the legendary Scholastic Book Fair, Scholastic (NASDAQ: SCHL) is an international company specializing in children's publishing, education, and media services.
Scholastic reported revenues of $335.4 million, up 3.6% year on year. This result missed analysts’ expectations by 3.5%. Taking a step back, it was a mixed quarter as it also produced an impressive beat of analysts’ EPS estimates but full-year EBITDA guidance missing analysts’ expectations.
The stock is up 14.5% since reporting and currently trades at $21.50.
Read our full, actionable report on Scholastic here, it’s free.
The New York Times (NYSE: NYT)
Founded in 1851, The New York Times (NYSE: NYT) is an American media organization known for its influential newspaper and expansive digital journalism platforms.
The New York Times reported revenues of $635.9 million, up 7.1% year on year. This number was in line with analysts’ expectations. Overall, it was a strong quarter as it also produced an impressive beat of analysts’ EPS estimates and a decent beat of analysts’ adjusted operating income estimates.
The New York Times pulled off the fastest revenue growth among its peers. The stock is up 6.3% since reporting and currently trades at $55.98.
Read our full, actionable report on The New York Times here, it’s free.
Market Update
As a result of the Fed’s rate hikes in 2022 and 2023, inflation has come down from frothy levels post-pandemic. The general rise in the price of goods and services is trending towards the Fed’s 2% goal as of late, which is good news. The higher rates that fought inflation also didn't slow economic activity enough to catalyze a recession. So far, soft landing. This, combined with recent rate cuts (half a percent in September 2024 and a quarter percent in November 2024) have led to strong stock market performance in 2024. The icing on the cake for 2024 returns was Donald Trump’s victory in the U.S. Presidential Election in early November, sending major indices to all-time highs in the week following the election. Still, debates around the health of the economy and the impact of potential tariffs and corporate tax cuts remain, leaving much uncertainty around 2025.
Want to invest in winners with rock-solid fundamentals? Check out our Hidden Gem Stocks and add them to your watchlist. These companies are poised for growth regardless of the political or macroeconomic climate.


