
Regional banking company Fulton Financial (NASDAQ: FULT) reported Q2 CY2025 results topping the market’s revenue expectations, but sales fell by 1.9% year on year to $328.4 million. Its GAAP profit of $0.53 per share was 24.7% above analysts’ consensus estimates.
Is now the time to buy Fulton Financial? Find out by accessing our full research report, it’s free.
Fulton Financial (FULT) Q2 CY2025 Highlights:
- Net Interest Income: $254.9 million vs analyst estimates of $255.1 million (5.5% year-on-year growth, in line)
- Net Interest Margin: 3.5% vs analyst estimates of 3.4% (6.2 basis point beat)
- Revenue: $328.4 million vs analyst estimates of $318 million (1.9% year-on-year decline, 3.3% beat)
- Efficiency Ratio: 57.1% vs analyst estimates of 61% (3.9 percentage point beat)
- EPS (GAAP): $0.53 vs analyst estimates of $0.43 (24.7% beat)
- Market Capitalization: $3.56 billion
"I'm proud that our team has delivered a new company record, with operating net income of $100.6 million, or $0.55 per diluted share, this past quarter," said Curt Myers, Chairman and CEO of Fulton.
Company Overview
Tracing its roots back to 1882 in the heart of Pennsylvania, Fulton Financial (NASDAQ: FULT) is a financial holding company that provides banking, lending, and wealth management services to consumers and businesses across five Mid-Atlantic states.
Sales Growth
In general, banks make money from two primary sources. The first is net interest income, which is interest earned on loans, mortgages, and investments in securities minus interest paid out on deposits. The second source is non-interest income, which can come from bank account, credit card, wealth management, investing banking, and trading fees.
Over the last five years, Fulton Financial grew its revenue at a solid 8.4% compounded annual growth rate. Its growth beat the average bank company and shows its offerings resonate with customers.
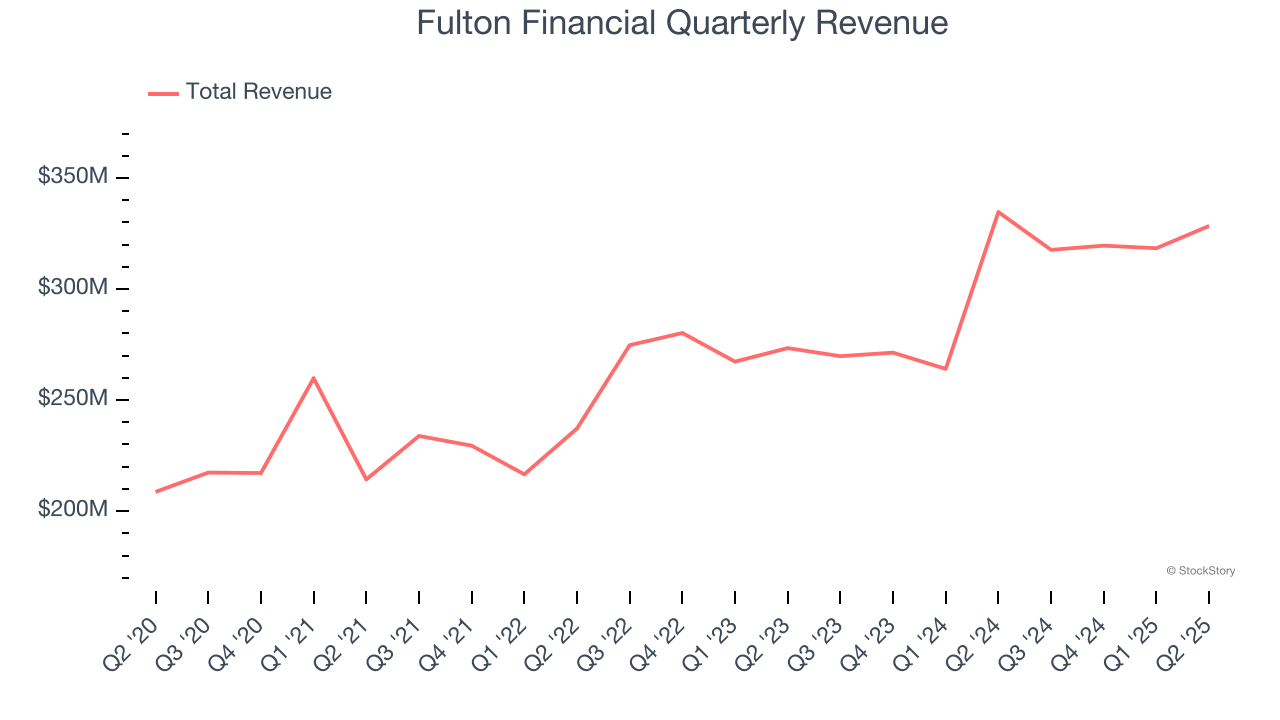
We at StockStory place the most emphasis on long-term growth, but within financials, a half-decade historical view may miss recent interest rate changes, market returns, and industry trends. Fulton Financial’s annualized revenue growth of 8.3% over the last two years aligns with its five-year trend, suggesting its demand was predictably strong. 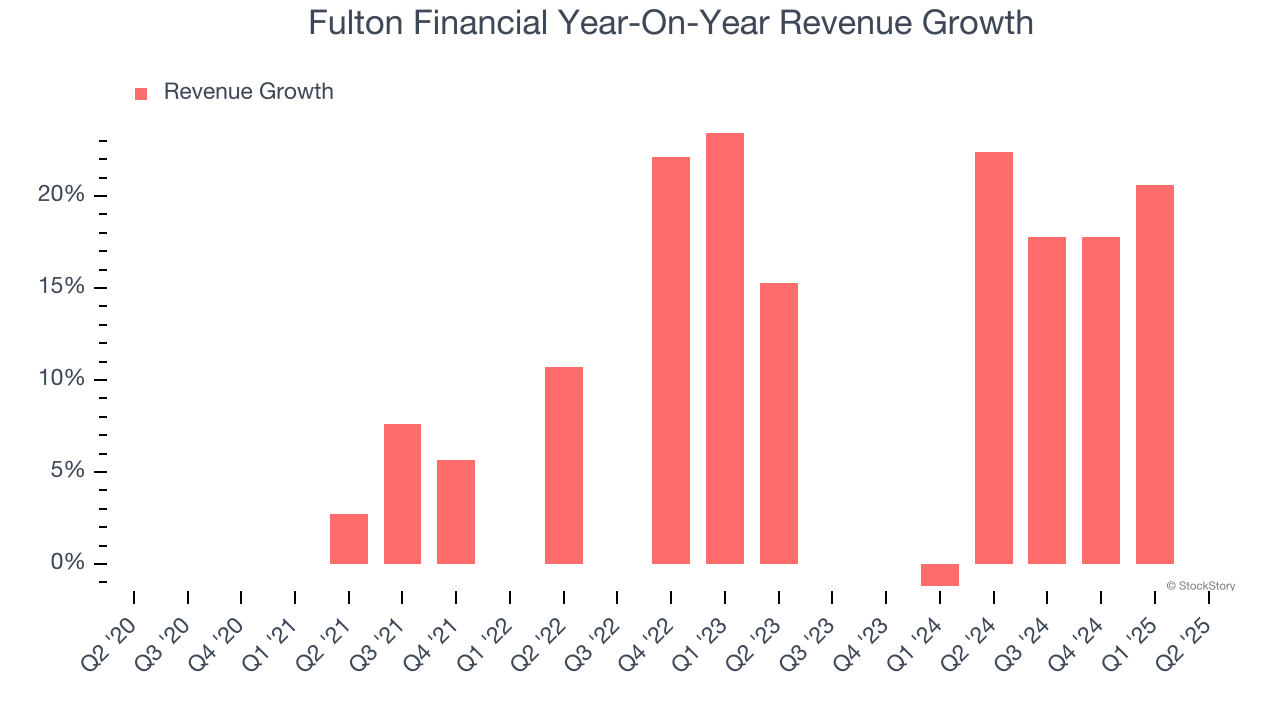 Note: Quarters not shown were determined to be outliers, impacted by outsized investment gains/losses that are not indicative of the recurring fundamentals of the business.
This quarter, Fulton Financial’s revenue fell by 1.9% year on year to $328.4 million but beat Wall Street’s estimates by 3.3%.
Net interest income made up 76.1% of the company’s total revenue during the last five years, meaning lending operations are Fulton Financial’s largest source of revenue.
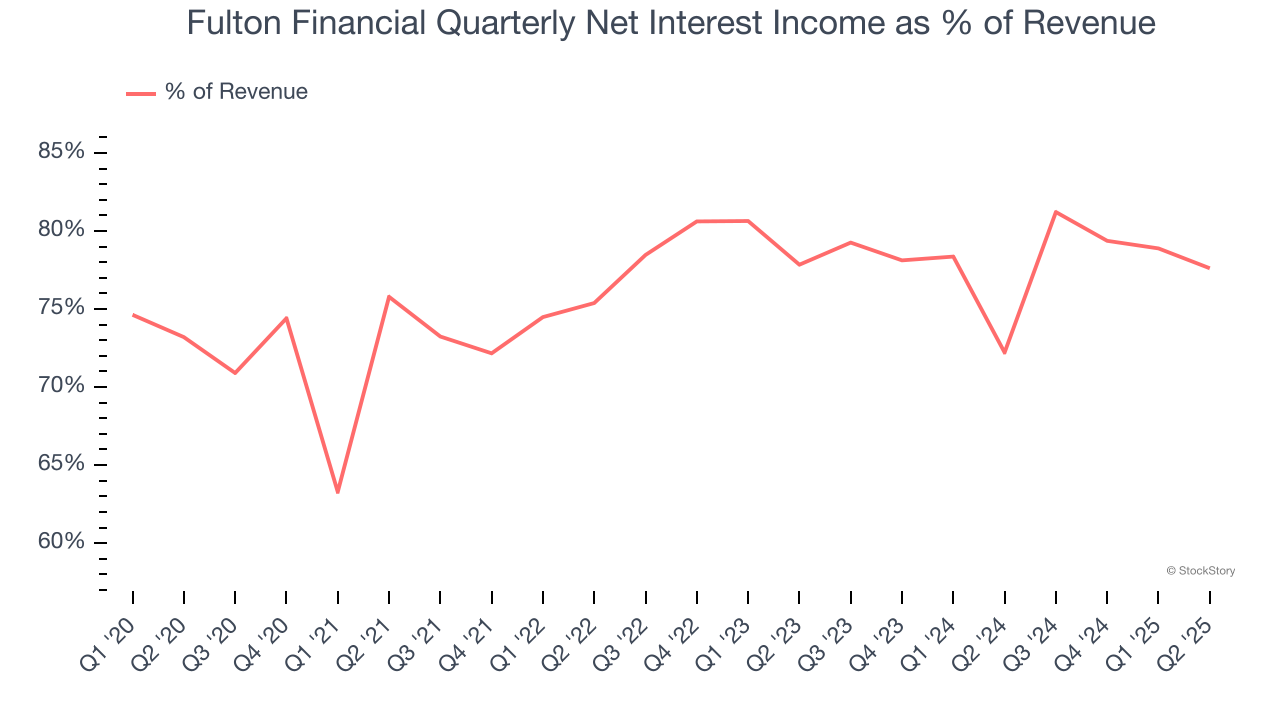
Our experience and research show the market cares primarily about a bank’s net interest income growth as non-interest income is considered a lower-quality and non-recurring revenue source.
Here at StockStory, we certainly understand the potential of thematic investing. Diverse winners from Microsoft (MSFT) to Alphabet (GOOG), Coca-Cola (KO) to Monster Beverage (MNST) could all have been identified as promising growth stories with a megatrend driving the growth. So, in that spirit, we’ve identified a relatively under-the-radar profitable growth stock benefiting from the rise of AI, available to you FREE via this link.
Net Interest Income
Fulton Financial’s net interest income has grown at a 10.1% annualized rate over the last five years, a step above the broader bank industry and faster than its total revenue.
When analyzing Fulton Financial’s net interest income over the last two years, we can see that growth decelerated to 8.2% annually.
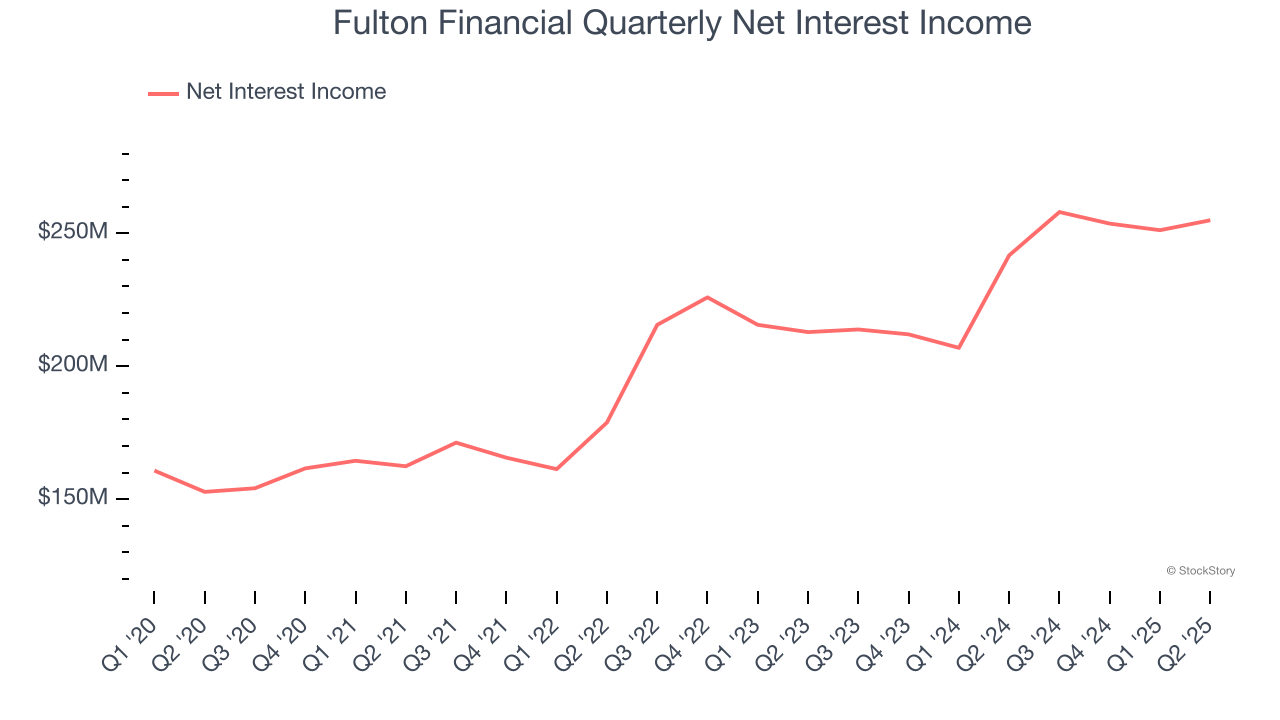
In Q2, Fulton Financial produced $254.9 million of net interest income, up 5.5% year on year and in line with Wall Street Consensus estimates. Net interest margin was 3.5%, beating sell-side expectations by 1.8%.
Looking ahead, sell-side analysts expect net interest income to grow 1.9% over the next 12 months, a deceleration versus the last two years.
Key Takeaways from Fulton Financial’s Q2 Results
We were impressed by how Fulton Financial blew past analysts’ revenue, net interest margin, efficiency ratio, and EPS expectations this quarter. Zooming out, we think this was a solid print. The stock remained flat at $19.11 immediately after reporting.
Fulton Financial put up rock-solid earnings, but one quarter doesn’t necessarily make the stock a buy. Let’s see if this is a good investment. What happened in the latest quarter matters, but not as much as longer-term business quality and valuation, when deciding whether to invest in this stock. We cover that in our actionable full research report which you can read here, it’s free.