
As the Q1 earnings season wraps, let’s dig into this quarter’s best and worst performers in the casino operator industry, including PENN Entertainment (NASDAQ: PENN) and its peers.
Casino operators enjoy limited competition because gambling is a highly regulated industry. These companies can also enjoy healthy margins and profits. Have you ever heard the phrase ‘the house always wins’? Regulation cuts both ways, however, and casinos may face stroke-of-the-pen risk that suddenly limits what they can or can't do and where they can do it. Furthermore, digitization is changing the game, pun intended. Whether it’s online poker or sports betting on your smartphone, innovation is forcing these players to adapt to changing consumer preferences, such as being able to wager anywhere on demand.
The 9 casino operator stocks we track reported a slower Q1. As a group, revenues were in line with analysts’ consensus estimates.
Luckily, casino operator stocks have performed well with share prices up 18.7% on average since the latest earnings results.
Weakest Q1: PENN Entertainment (NASDAQ: PENN)
Established in 1982, PENN Entertainment (NASDAQ: PENN) is a diversified American operator of casinos, sports betting, and entertainment venues.
PENN Entertainment reported revenues of $1.67 billion, up 4.1% year on year. This print fell short of analysts’ expectations by 1.6%. Overall, it was a disappointing quarter for the company with a significant miss of analysts’ EBITDA estimates and a significant miss of analysts’ EPS estimates.
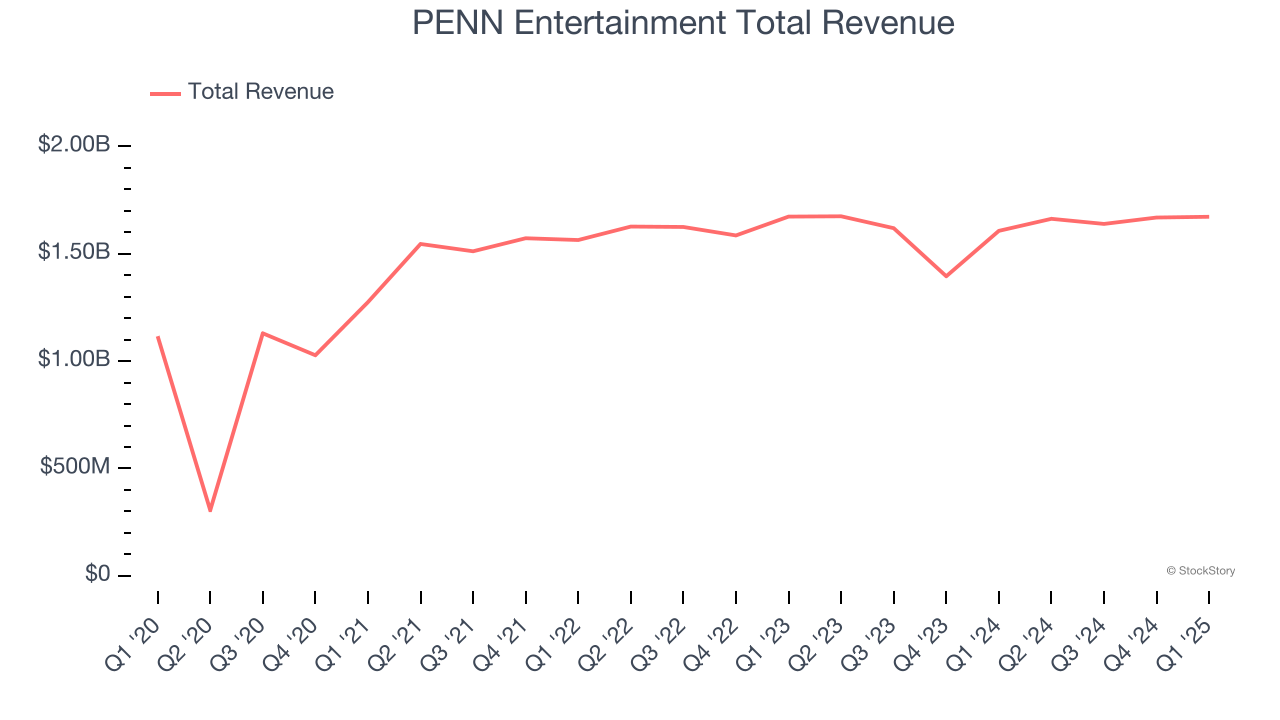
PENN Entertainment scored the fastest revenue growth of the whole group. Unsurprisingly, the stock is up 11.8% since reporting and currently trades at $17.56.
Read our full report on PENN Entertainment here, it’s free.
Best Q1: Monarch (NASDAQ: MCRI)
Established in 1993, Monarch (NASDAQ: MCRI) operates luxury casinos and resorts, offering high-end gaming, dining, and hospitality experiences.
Monarch reported revenues of $125.4 million, up 3.1% year on year, outperforming analysts’ expectations by 2.1%. The business had a strong quarter with a decent beat of analysts’ EPS estimates and a decent beat of analysts’ EBITDA estimates.
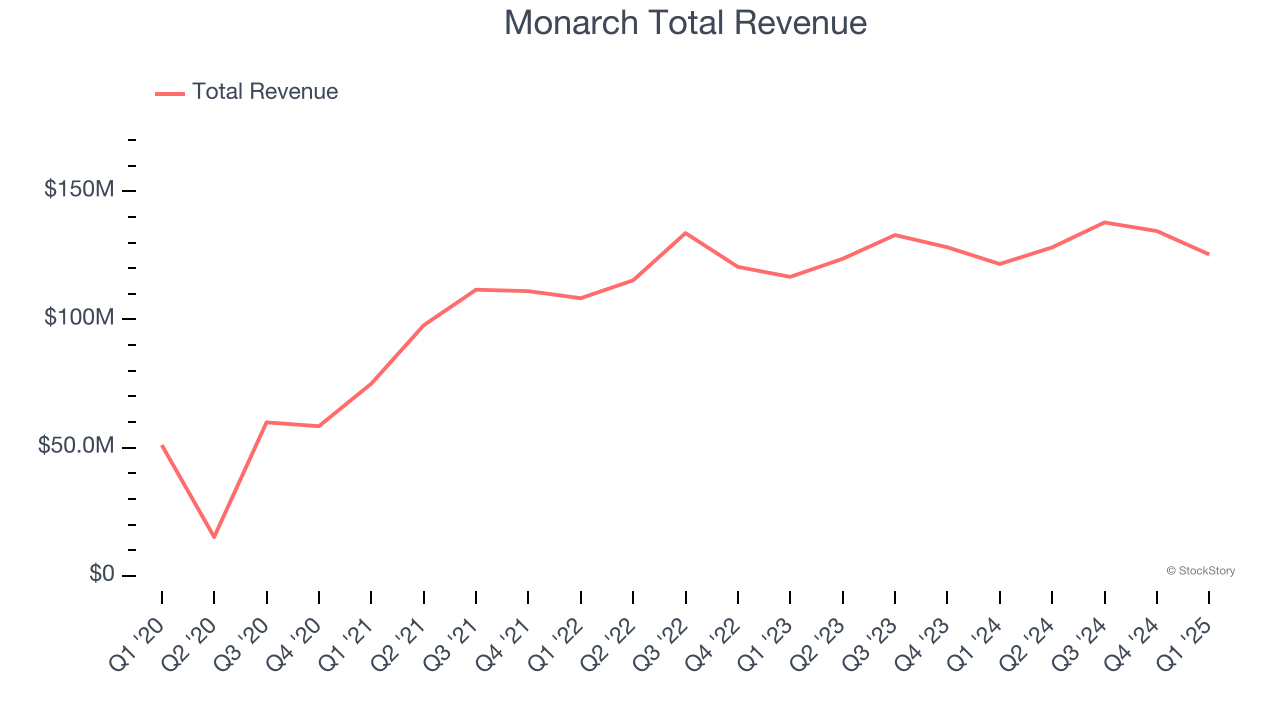
Monarch delivered the biggest analyst estimates beat among its peers. The market seems happy with the results as the stock is up 15.3% since reporting. It currently trades at $87.50.
Is now the time to buy Monarch? Access our full analysis of the earnings results here, it’s free.
Wynn Resorts (NASDAQ: WYNN)
Founded by the former Mirage Resorts CEO, Wynn Resorts (NASDAQ: WYNN) is a global developer and operator of high-end hotels and casinos, known for its luxurious properties and premium guest services.
Wynn Resorts reported revenues of $1.7 billion, down 8.7% year on year, falling short of analysts’ expectations by 1.8%. It was a disappointing quarter as it posted a significant miss of analysts’ EPS and EBITDA estimates.
Wynn Resorts delivered the slowest revenue growth in the group. Interestingly, the stock is up 32.3% since the results and currently trades at $110.56.
Read our full analysis of Wynn Resorts’s results here.
MGM Resorts (NYSE: MGM)
Operating several properties on the Las Vegas Strip, MGM Resorts (NYSE: MGM) is a global hospitality and entertainment company known for its resorts and casinos.
MGM Resorts reported revenues of $4.28 billion, down 2.4% year on year. This number met analysts’ expectations. Zooming out, it was a satisfactory quarter as it also produced an impressive beat of analysts’ EPS estimates.
The stock is up 21.3% since reporting and currently trades at $38.14.
Read our full, actionable report on MGM Resorts here, it’s free.
Red Rock Resorts (NASDAQ: RRR)
Founded in 1976, Red Rock Resorts (NASDAQ: RRR) operates a range of casino resorts and entertainment properties, primarily in the Las Vegas metropolitan area.
Red Rock Resorts reported revenues of $497.9 million, up 1.8% year on year. This result beat analysts’ expectations by 0.6%. Taking a step back, it was a satisfactory quarter as it also recorded a solid beat of analysts’ EPS estimates but a miss of analysts’ Casino revenue estimates.
The stock is up 33.6% since reporting and currently trades at $56.30.
Read our full, actionable report on Red Rock Resorts here, it’s free.
Market Update
Thanks to the Fed’s rate hikes in 2022 and 2023, inflation has been on a steady path downward, easing back toward that 2% sweet spot. Fortunately (miraculously to some), all this tightening didn’t send the economy tumbling into a recession, so here we are, cautiously celebrating a soft landing. The cherry on top? Recent rate cuts (half a point in September 2024, a quarter in November) have propped up markets, especially after Trump’s November win lit a fire under major indices and sent them to all-time highs. However, there’s still plenty to ponder — tariffs, corporate tax cuts, and what 2025 might hold for the economy.
Want to invest in winners with rock-solid fundamentals? Check out our Top 5 Quality Compounder Stocks and add them to your watchlist. These companies are poised for growth regardless of the political or macroeconomic climate.
StockStory is growing and hiring equity analyst and marketing roles. Are you a 0 to 1 builder passionate about the markets and AI? See the open roles here.


