
Earnings results often indicate what direction a company will take in the months ahead. With Q1 behind us, let’s have a look at Red Rock Resorts (NASDAQ: RRR) and its peers.
Casino operators enjoy limited competition because gambling is a highly regulated industry. These companies can also enjoy healthy margins and profits. Have you ever heard the phrase ‘the house always wins’? Regulation cuts both ways, however, and casinos may face stroke-of-the-pen risk that suddenly limits what they can or can't do and where they can do it. Furthermore, digitization is changing the game, pun intended. Whether it’s online poker or sports betting on your smartphone, innovation is forcing these players to adapt to changing consumer preferences, such as being able to wager anywhere on demand.
The 9 casino operator stocks we track reported a slower Q1. As a group, revenues were in line with analysts’ consensus estimates.
Luckily, casino operator stocks have performed well with share prices up 18.7% on average since the latest earnings results.
Red Rock Resorts (NASDAQ: RRR)
Founded in 1976, Red Rock Resorts (NASDAQ: RRR) operates a range of casino resorts and entertainment properties, primarily in the Las Vegas metropolitan area.
Red Rock Resorts reported revenues of $497.9 million, up 1.8% year on year. This print exceeded analysts’ expectations by 0.6%. Overall, it was a satisfactory quarter for the company with an impressive beat of analysts’ EPS estimates but a miss of analysts’ Casino revenue estimates.
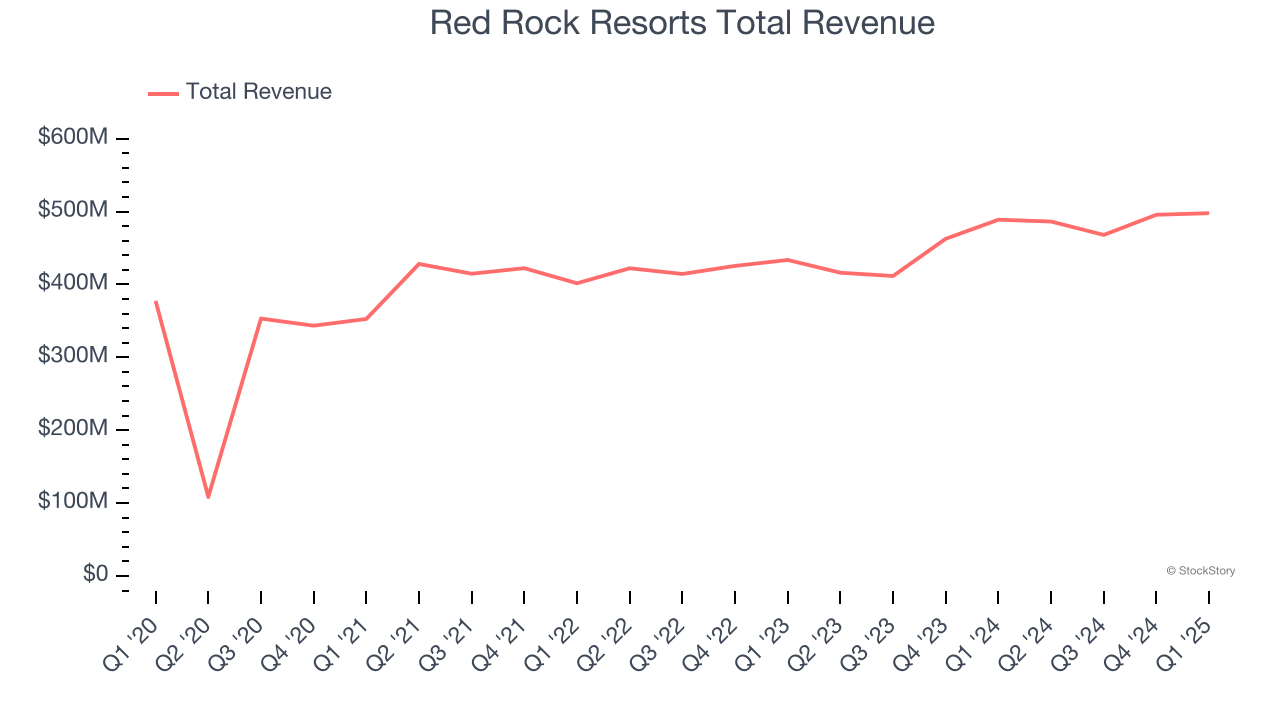
Interestingly, the stock is up 33.6% since reporting and currently trades at $56.30.
Is now the time to buy Red Rock Resorts? Access our full analysis of the earnings results here, it’s free.
Best Q1: Monarch (NASDAQ: MCRI)
Established in 1993, Monarch (NASDAQ: MCRI) operates luxury casinos and resorts, offering high-end gaming, dining, and hospitality experiences.
Monarch reported revenues of $125.4 million, up 3.1% year on year, outperforming analysts’ expectations by 2.1%. The business had a strong quarter with a decent beat of analysts’ EPS and EBITDA estimates.
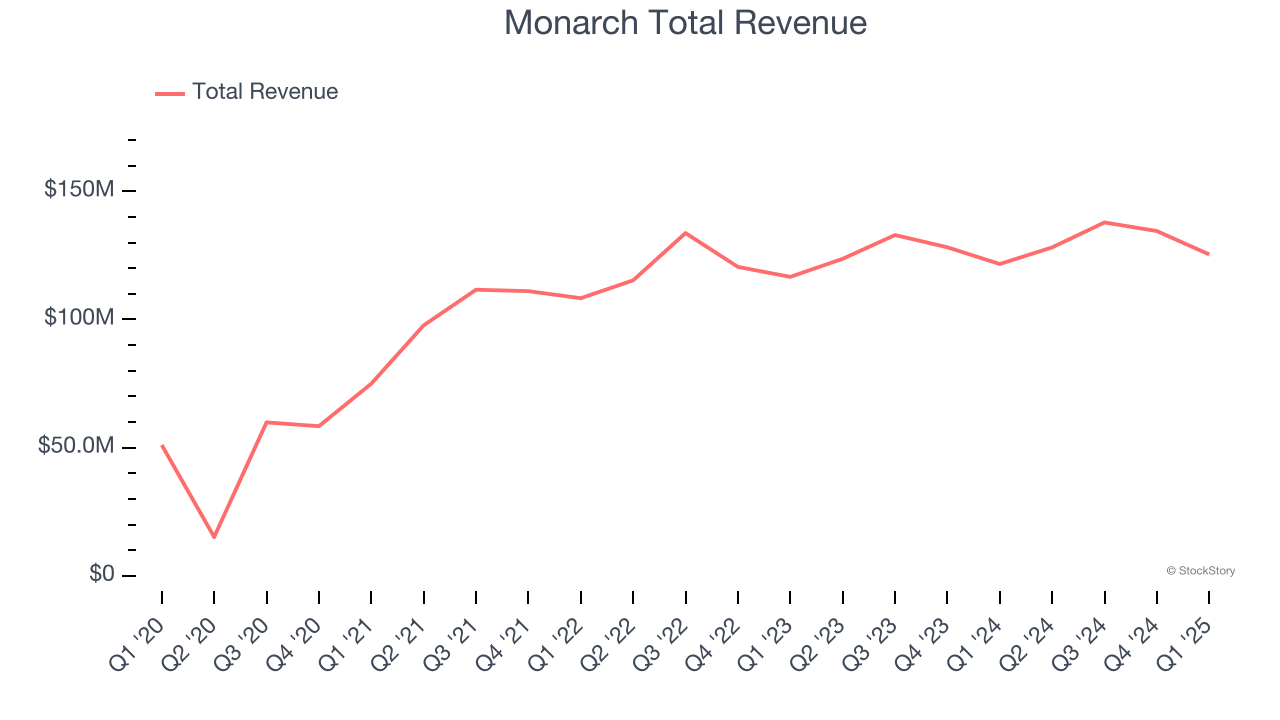
Monarch achieved the biggest analyst estimates beat among its peers. The market seems happy with the results as the stock is up 15.3% since reporting. It currently trades at $87.50.
Is now the time to buy Monarch? Access our full analysis of the earnings results here, it’s free.
Weakest Q1: PENN Entertainment (NASDAQ: PENN)
Established in 1982, PENN Entertainment (NASDAQ: PENN) is a diversified American operator of casinos, sports betting, and entertainment venues.
PENN Entertainment reported revenues of $1.67 billion, up 4.1% year on year, falling short of analysts’ expectations by 1.6%. It was a disappointing quarter as it posted a significant miss of analysts’ EBITDA and EPS estimates.
Interestingly, the stock is up 11.8% since the results and currently trades at $17.56.
Read our full analysis of PENN Entertainment’s results here.
Wynn Resorts (NASDAQ: WYNN)
Founded by the former Mirage Resorts CEO, Wynn Resorts (NASDAQ: WYNN) is a global developer and operator of high-end hotels and casinos, known for its luxurious properties and premium guest services.
Wynn Resorts reported revenues of $1.7 billion, down 8.7% year on year. This result lagged analysts' expectations by 1.8%. It was a disappointing quarter as it also produced a significant miss of analysts’ EPS and EBITDA estimates.
Wynn Resorts had the slowest revenue growth among its peers. The stock is up 32.3% since reporting and currently trades at $110.56.
Read our full, actionable report on Wynn Resorts here, it’s free.
Golden Entertainment (NASDAQ: GDEN)
Founded in 2001, Golden Entertainment (NASDAQ: GDEN) is a gaming company operating casinos, taverns, and distributed gaming platforms.
Golden Entertainment reported revenues of $160.8 million, down 7.6% year on year. This print came in 2.1% below analysts' expectations. Overall, it was a softer quarter as it also logged a significant miss of analysts’ EPS estimates and a miss of analysts’ adjusted operating income estimates.
Golden Entertainment had the weakest performance against analyst estimates among its peers. The stock is up 25.7% since reporting and currently trades at $32.59.
Read our full, actionable report on Golden Entertainment here, it’s free.
Market Update
As a result of the Fed’s rate hikes in 2022 and 2023, inflation has come down from frothy levels post-pandemic. The general rise in the price of goods and services is trending towards the Fed’s 2% goal as of late, which is good news. The higher rates that fought inflation also didn't slow economic activity enough to catalyze a recession. So far, soft landing. This, combined with recent rate cuts (half a percent in September 2024 and a quarter percent in November 2024) have led to strong stock market performance in 2024. The icing on the cake for 2024 returns was Donald Trump’s victory in the U.S. Presidential Election in early November, sending major indices to all-time highs in the week following the election. Still, debates around the health of the economy and the impact of potential tariffs and corporate tax cuts remain, leaving much uncertainty around 2025.
Want to invest in winners with rock-solid fundamentals? Check out our Top 6 Stocks and add them to your watchlist. These companies are poised for growth regardless of the political or macroeconomic climate.
StockStory is growing and hiring equity analyst and marketing roles. Are you a 0 to 1 builder passionate about the markets and AI? See the open roles here.


