
Regional banking company M&T Bank (NYSE: MTB) fell short of the market’s revenue expectations in Q2 CY2025, with sales falling 1.3% year on year to $2.27 billion. Its GAAP profit of $4.24 per share was 6.3% above analysts’ consensus estimates.
Is now the time to buy M&T Bank? Find out by accessing our full research report, it’s free.
M&T Bank (MTB) Q2 CY2025 Highlights:
- Net Interest Income: $1.71 billion vs analyst estimates of $1.75 billion (flat year on year, 2% miss)
- Net Interest Margin: 3.6% vs analyst estimates of 3.7% (3 basis point year-on-year increase, 6.6 bps miss)
- Revenue: $2.27 billion vs analyst estimates of $2.38 billion (1.3% year-on-year decline, 4.6% miss)
- Efficiency Ratio: 55.2% vs analyst estimates of 55.8% (0.6 percentage point beat)
- EPS (GAAP): $4.24 vs analyst estimates of $3.99 (6.3% beat)
- Market Capitalization: $31.67 billion
Company Overview
Tracing its roots back to 1856 when it was founded as Manufacturers and Traders Bank in Buffalo, New York, M&T Bank (NYSE: MTB) is a regional bank holding company that provides retail and commercial banking, trust, wealth management, and investment services to consumers and businesses.
Sales Growth
Net interest income and and fee-based revenue are the two pillars supporting bank earnings. The former captures profit from the gap between lending rates and deposit costs, while the latter encompasses charges for banking services, credit products, wealth management, and trading activities.
Over the last five years, M&T Bank grew its revenue at an impressive 9% compounded annual growth rate. Its growth beat the average bank company and shows its offerings resonate with customers.
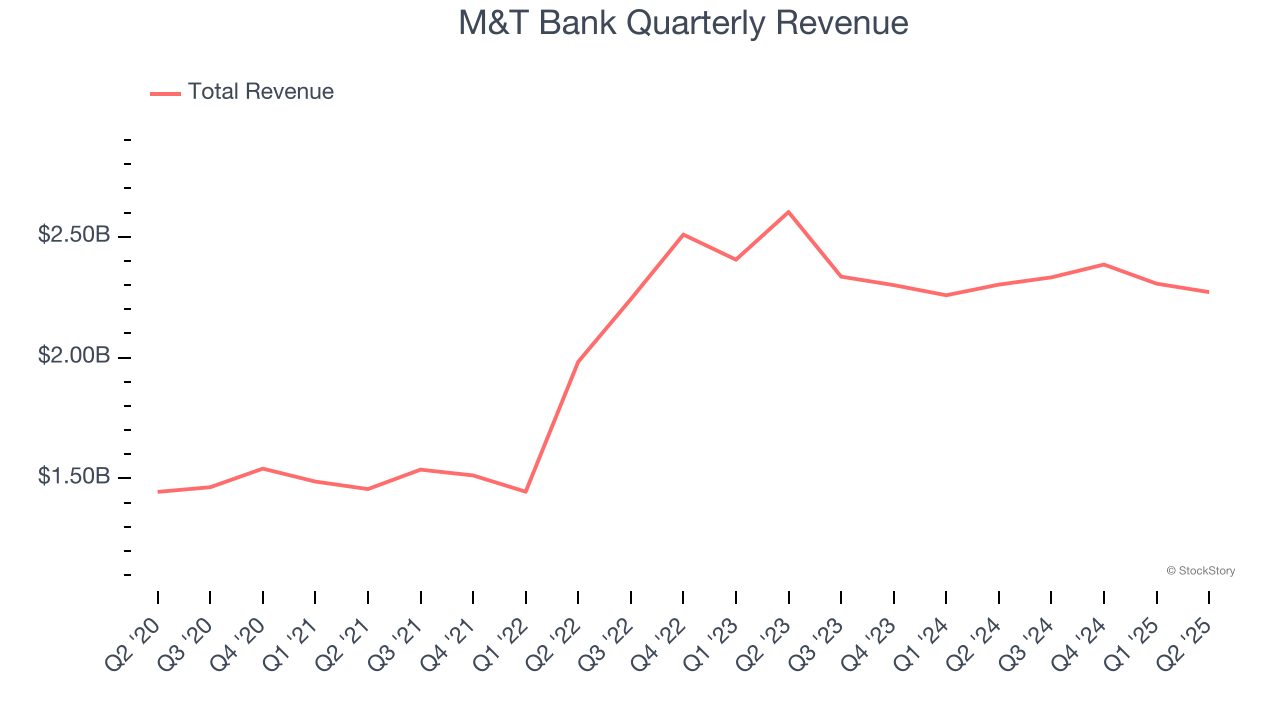
We at StockStory place the most emphasis on long-term growth, but within financials, a half-decade historical view may miss recent interest rate changes, market returns, and industry trends. M&T Bank’s recent performance marks a sharp pivot from its five-year trend as its revenue has shown annualized declines of 2.4% over the last two years. 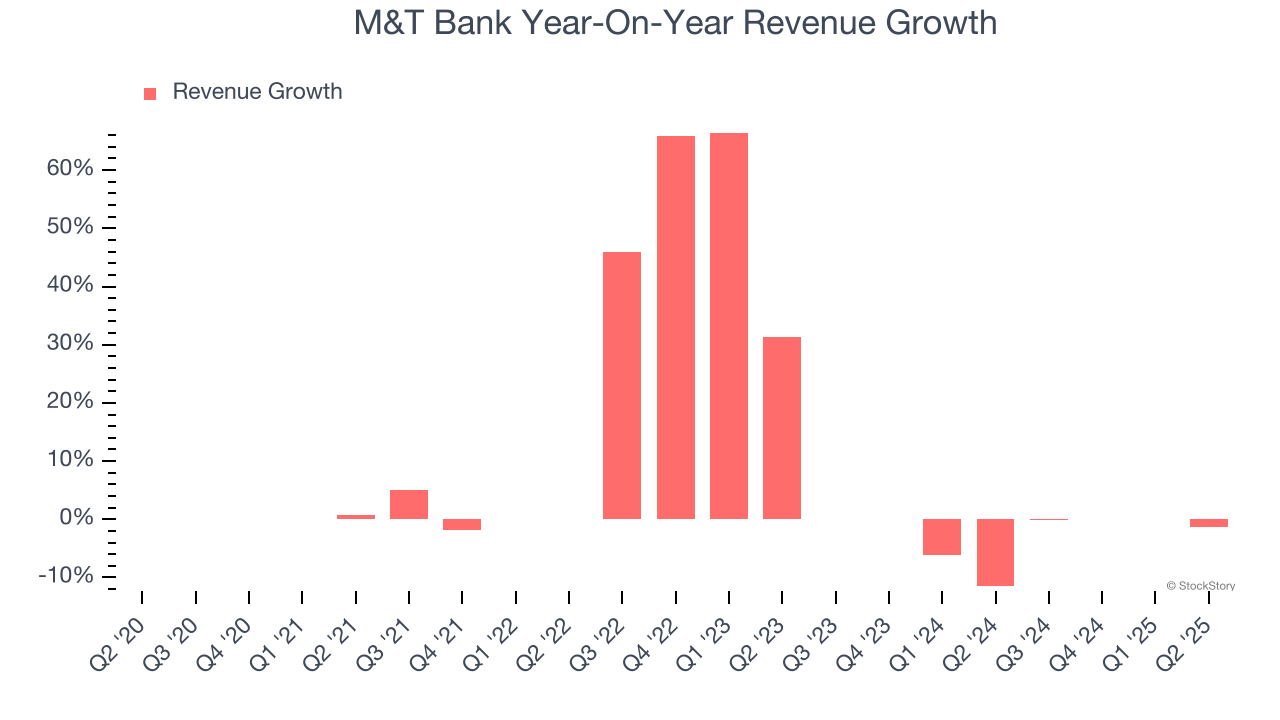 Note: Quarters not shown were determined to be outliers, impacted by outsized investment gains/losses that are not indicative of the recurring fundamentals of the business.
This quarter, M&T Bank missed Wall Street’s estimates and reported a rather uninspiring 1.3% year-on-year revenue decline, generating $2.27 billion of revenue.
Net interest income made up 70.3% of the company’s total revenue during the last five years, meaning lending operations are M&T Bank’s largest source of revenue.
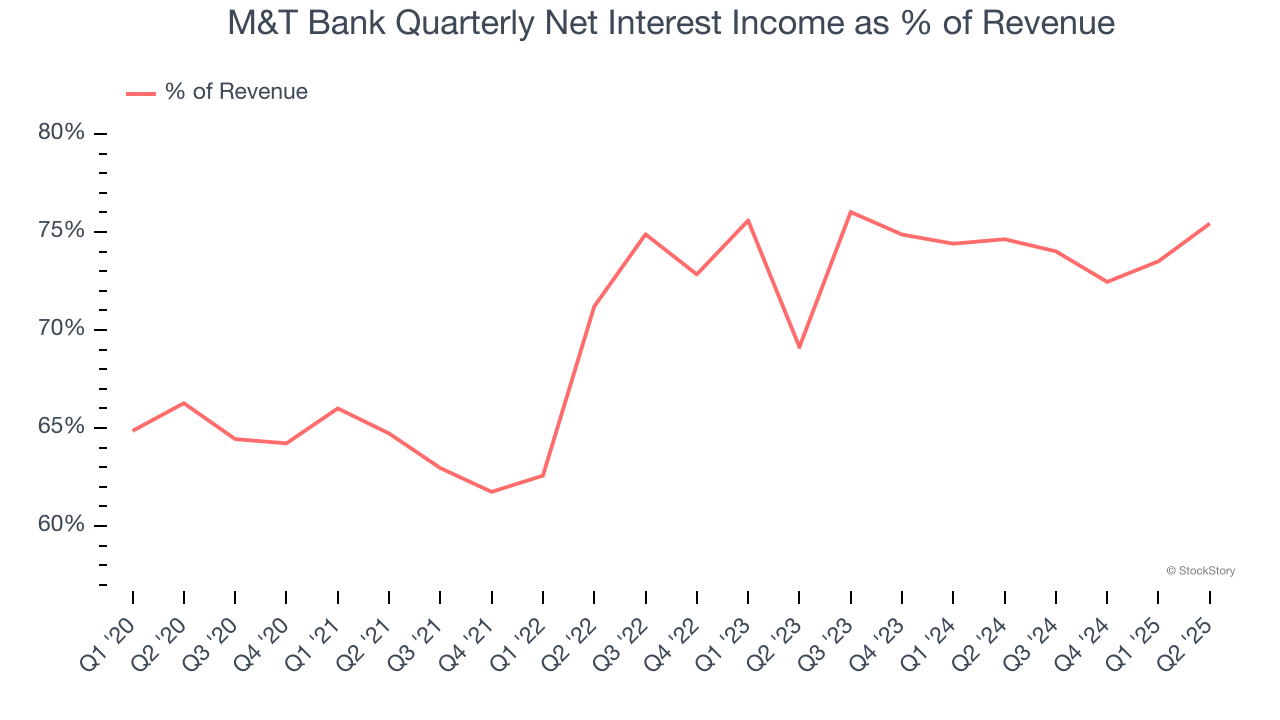
Our experience and research show the market cares primarily about a bank’s net interest income growth as non-interest income is considered a lower-quality and non-recurring revenue source.
Today’s young investors won’t have read the timeless lessons in Gorilla Game: Picking Winners In High Technology because it was written more than 20 years ago when Microsoft and Apple were first establishing their supremacy. But if we apply the same principles, then enterprise software stocks leveraging their own generative AI capabilities may well be the Gorillas of the future. So, in that spirit, we are excited to present our Special Free Report on a profitable, fast-growing enterprise software stock that is already riding the automation wave and looking to catch the generative AI next.
Tangible Book Value Per Share (TBVPS)
Banks are balance sheet-driven businesses because they generate earnings primarily through borrowing and lending. They’re also valued based on their balance sheet strength and ability to compound book value (another name for shareholders’ equity) over time.
This explains why tangible book value per share (TBVPS) stands as the premier banking metric. TBVPS strips away questionable intangible assets, revealing concrete per-share net worth that investors can trust. Other (and more commonly known) per-share metrics like EPS can sometimes be murky due to M&A or accounting rules allowing for loan losses to be spread out.
M&T Bank’s TBVPS grew at an impressive 7.4% annual clip over the last five years. TBVPS growth has also accelerated recently, growing by 11% annually over the last two years from $91.32 to $112.48 per share.
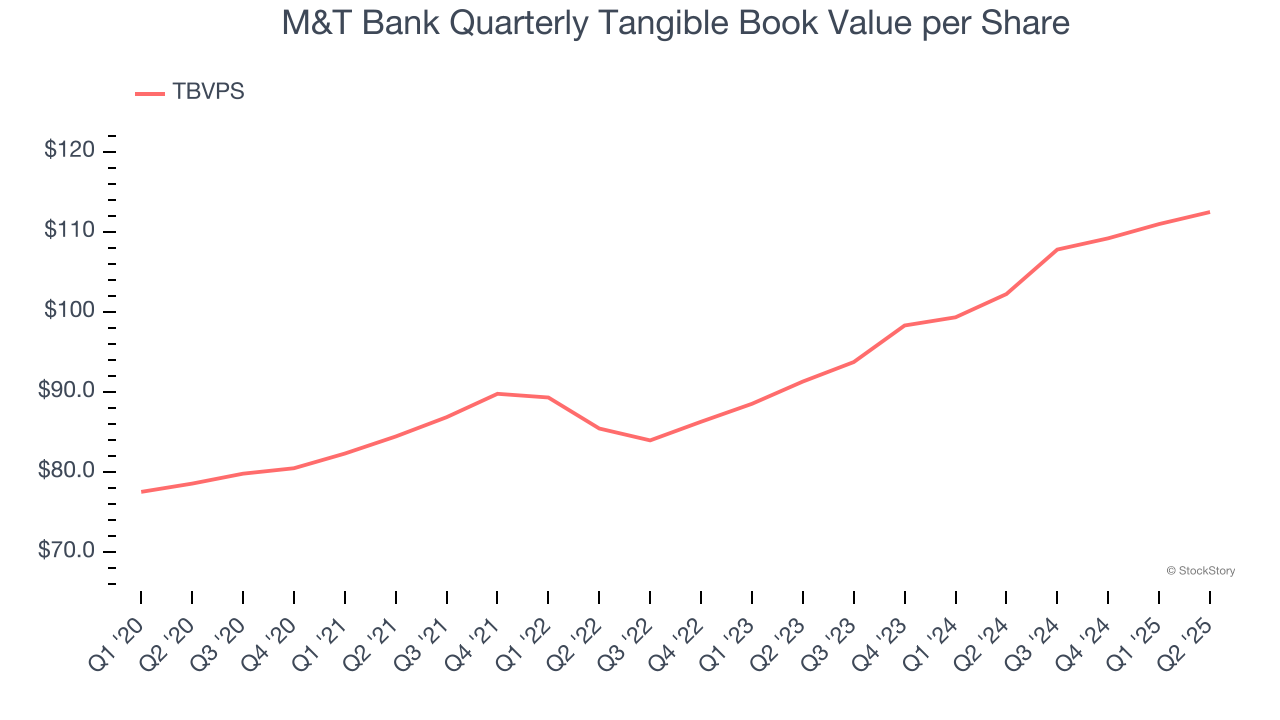
Over the next 12 months, Consensus estimates call for M&T Bank’s TBVPS to grow by 5.6% to $118.76, mediocre growth rate.
Key Takeaways from M&T Bank’s Q2 Results
M&T Bank's revenue and net interest income fell short of Wall Street’s estimates. On the other hand, operational efficiency beat, leading to better-than-expected EPS. Overall, this was a mixed quarter. The stock traded up 1.5% to $200 immediately following the results.
So should you invest in M&T Bank right now? We think that the latest quarter is only one piece of the longer-term business quality puzzle. Quality, when combined with valuation, can help determine if the stock is a buy. We cover that in our actionable full research report which you can read here, it’s free.


