
Regional banking company Independent Bank (NASDAQ: INDB) reported revenue ahead of Wall Street’s expectations in Q2 CY2025, with sales up 6.8% year on year to $181.8 million. Its GAAP profit of $1.20 per share was 2.4% below analysts’ consensus estimates.
Is now the time to buy Independent Bank? Find out by accessing our full research report, it’s free.
Independent Bank (INDB) Q2 CY2025 Highlights:
- Net Interest Income: $147.5 million vs analyst estimates of $146.6 million (6.9% year-on-year growth, 0.6% beat)
- Net Interest Margin: 3.4% vs analyst estimates of 3.3% (12 basis point year-on-year increase, 4.5 bps beat)
- Revenue: $181.8 million vs analyst estimates of $177.6 million (6.8% year-on-year growth, 2.4% beat)
- Efficiency Ratio: 59.8% vs analyst estimates of 58.2% (1.7 percentage point miss)
- EPS (GAAP): $1.20 vs analyst expectations of $1.23 (2.4% miss)
- Market Capitalization: $3.22 billion
Company Overview
Tracing its roots back to 1907 and serving as a financial cornerstone in New England for over a century, Independent Bank Corp. (NASDAQ: INDB) operates as the holding company for Rockland Trust, providing banking, investment, and financial services across Eastern Massachusetts and Rhode Island.
Sales Growth
Two primary revenue streams drive bank earnings. While net interest income, which is earned by charging higher rates on loans than paid on deposits, forms the foundation, fee-based services across banking, credit, wealth management, and trading operations provide additional income.
Luckily, Independent Bank’s revenue grew at a decent 7% compounded annual growth rate over the last five years. Its growth was slightly above the average bank company and shows its offerings resonate with customers.
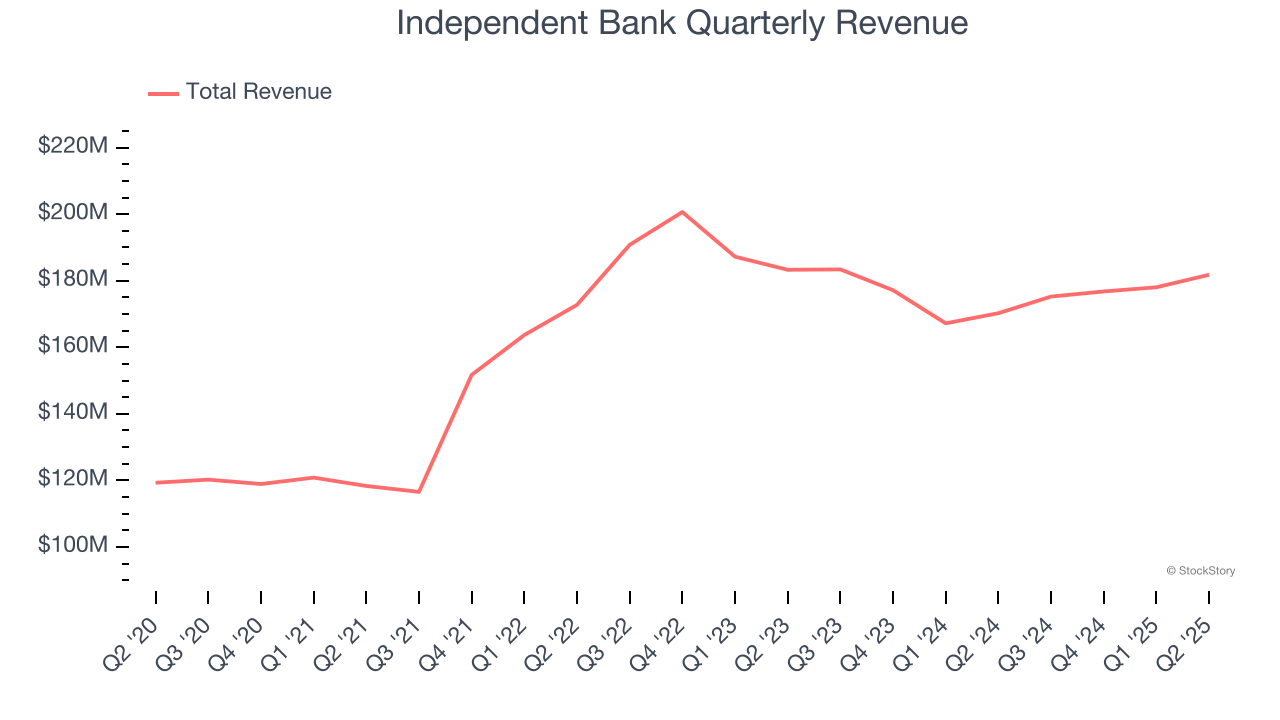
We at StockStory place the most emphasis on long-term growth, but within financials, a half-decade historical view may miss recent interest rate changes, market returns, and industry trends. Independent Bank’s recent performance marks a sharp pivot from its five-year trend as its revenue has shown annualized declines of 3.3% over the last two years. 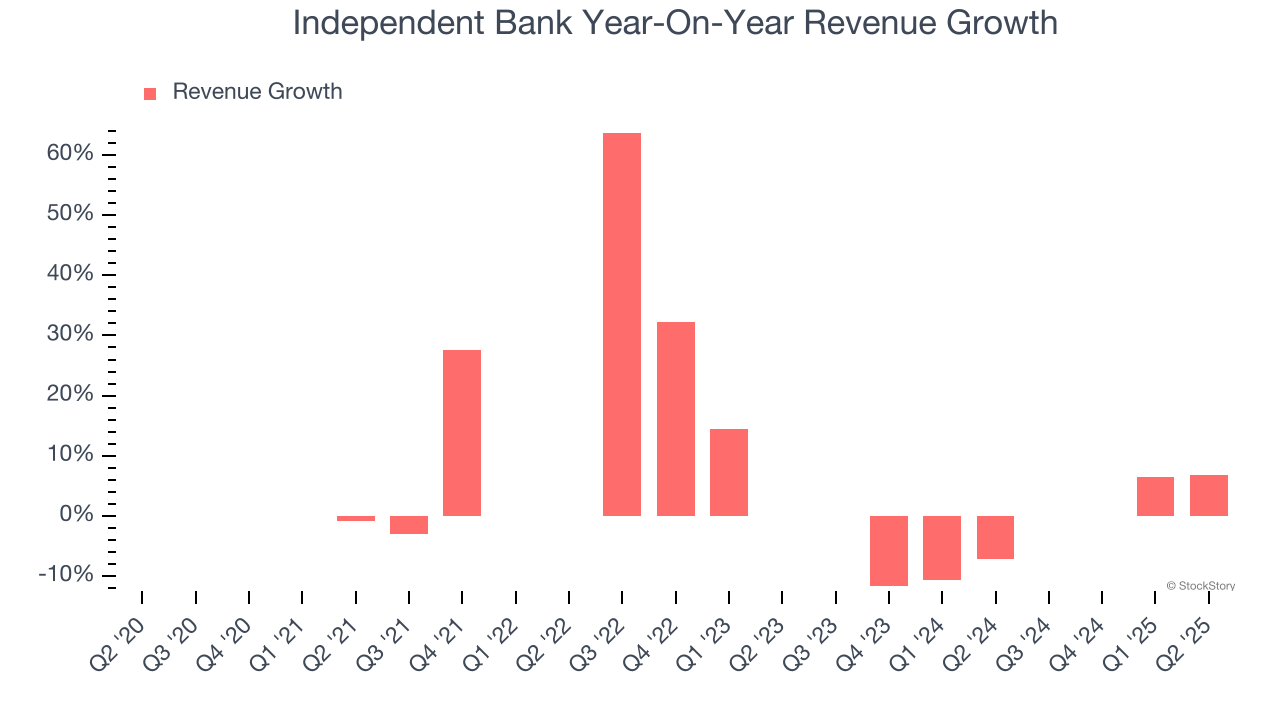 Note: Quarters not shown were determined to be outliers, impacted by outsized investment gains/losses that are not indicative of the recurring fundamentals of the business.
This quarter, Independent Bank reported year-on-year revenue growth of 6.8%, and its $181.8 million of revenue exceeded Wall Street’s estimates by 2.4%.
Net interest income made up 81.3% of the company’s total revenue during the last five years, meaning Independent Bank barely relies on non-interest income to drive its overall growth.
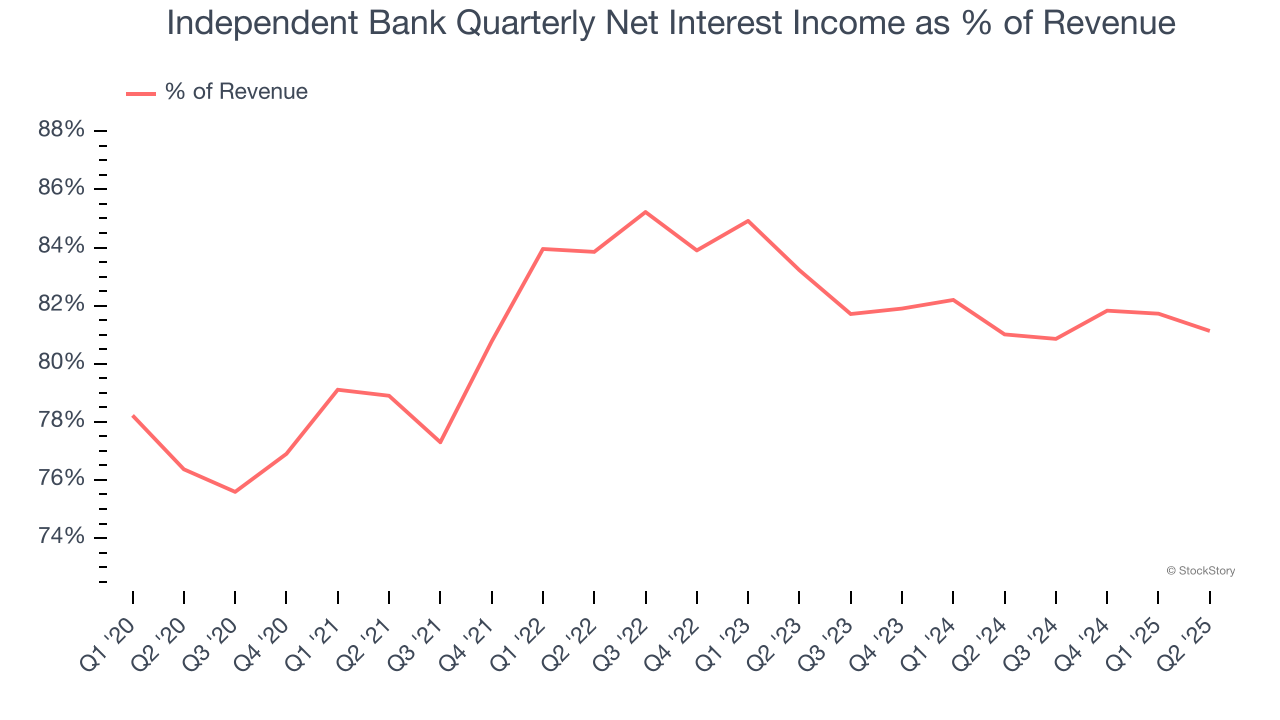
Our experience and research show the market cares primarily about a bank’s net interest income growth as non-interest income is considered a lower-quality and non-recurring revenue source.
Software is eating the world and there is virtually no industry left that has been untouched by it. That drives increasing demand for tools helping software developers do their jobs, whether it be monitoring critical cloud infrastructure, integrating audio and video functionality, or ensuring smooth content streaming. Click here to access a free report on our 3 favorite stocks to play this generational megatrend.
Tangible Book Value Per Share (TBVPS)
Banks are balance sheet-driven businesses because they generate earnings primarily through borrowing and lending. They’re also valued based on their balance sheet strength and ability to compound book value (another name for shareholders’ equity) over time.
This explains why tangible book value per share (TBVPS) stands as the premier banking metric. TBVPS strips away questionable intangible assets, revealing concrete per-share net worth that investors can trust. Traditional metrics like EPS are helpful but face distortion from M&A activity and loan loss accounting rules.
Independent Bank’s TBVPS grew at an impressive 7.1% annual clip over the last five years. The last two years show a similar trajectory as TBVPS grew by 7.9% annually from $41.88 to $48.80 per share.
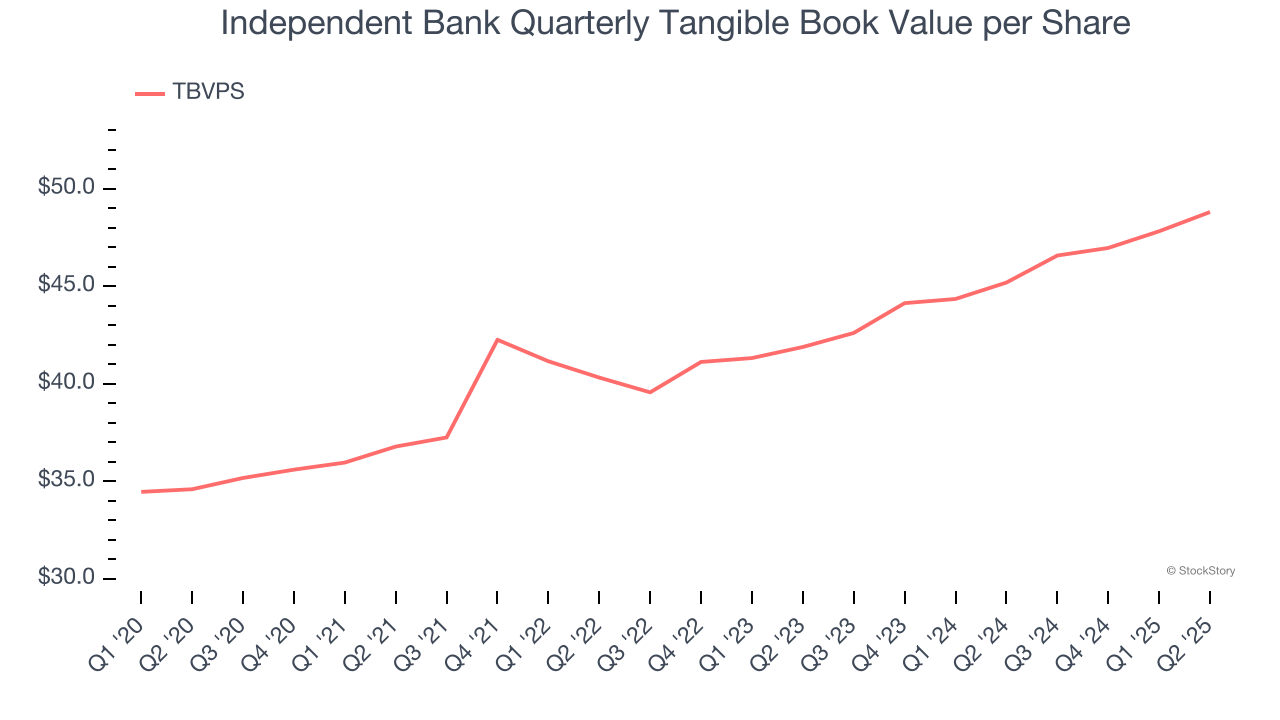
Over the next 12 months, Consensus estimates call for Independent Bank’s TBVPS to shrink by 1.1% to $48.28, a sour projection.
Key Takeaways from Independent Bank’s Q2 Results
It was encouraging to see Independent Bank beat analysts’ revenue, net interest income, and NIM expectations this quarter. We were also happy its tangible book value per share narrowly outperformed Wall Street’s estimates. On the other hand, its EPS and efficiency ratio missed. Overall, this was a softer quarter. The stock remained flat at $65.69 immediately after reporting.
So should you invest in Independent Bank right now? When making that decision, it’s important to consider its valuation, business qualities, as well as what has happened in the latest quarter. We cover that in our actionable full research report which you can read here, it’s free.


