Food and beverage company PepsiCo (NASDAQ: PEP) beat Wall Street’s revenue expectations in Q2 CY2025, but sales were flat year on year at $22.73 billion. Its non-GAAP profit of $2.12 per share was 4.5% above analysts’ consensus estimates.
Is now the time to buy PepsiCo? Find out by accessing our full research report, it’s free.
PepsiCo (PEP) Q2 CY2025 Highlights:
- Revenue: $22.73 billion vs analyst estimates of $22.35 billion (flat year on year, 1.7% beat)
- Adjusted EPS: $2.12 vs analyst estimates of $2.03 (4.5% beat)
- Adjusted EBITDA: $3.18 billion vs analyst estimates of $4.58 billion (14% margin, 30.6% miss)
- Operating Margin: 7.9%, down from 18% in the same quarter last year
- Free Cash Flow Margin: 4.1%, down from 6.2% in the same quarter last year
- Organic Revenue rose 2.1% year on year, in line with the same quarter last year
- Sales Volumes fell 1.5% year on year (-3% in the same quarter last year)
- Market Capitalization: $185.6 billion
Company Overview
With a history that goes back more than a century, PepsiCo (NASDAQ: PEP) is a household name in food and beverages today and best known for its flagship soda.
Revenue Growth
A company’s long-term sales performance is one signal of its overall quality. Any business can have short-term success, but a top-tier one grows for years.
With $91.75 billion in revenue over the past 12 months, PepsiCo is one of the most widely recognized consumer staples companies. Its influence over consumers gives it negotiating leverage with distributors, enabling it to pick and choose where it sells its products (a luxury many don’t have). However, its scale is a double-edged sword because there are only a finite number of major retail partners, placing a ceiling on its growth. To accelerate sales, PepsiCo likely needs to optimize its pricing or lean into new products and international expansion.
As you can see below, PepsiCo’s 3.9% annualized revenue growth over the last three years was sluggish as consumers bought less of its products. We’ll explore what this means in the "Volume Growth" section.
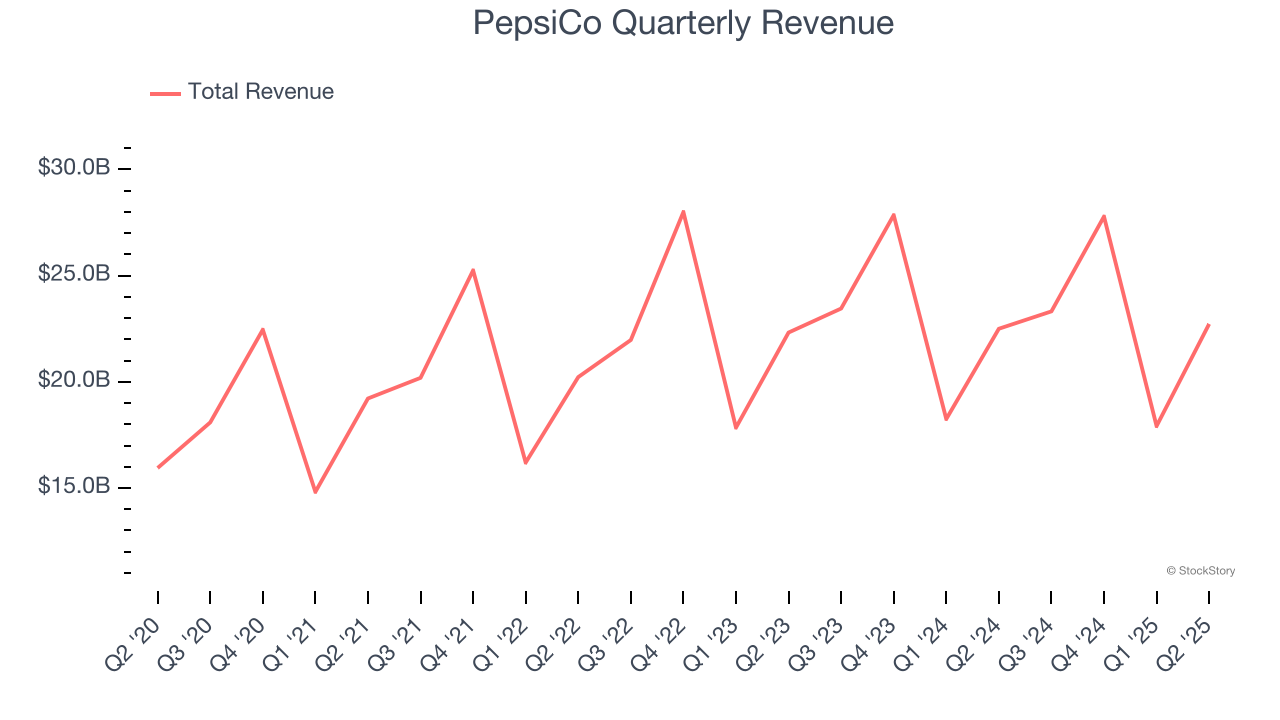
This quarter, PepsiCo’s $22.73 billion of revenue was flat year on year but beat Wall Street’s estimates by 1.7%.
Looking ahead, sell-side analysts expect revenue to grow 1.8% over the next 12 months, a slight deceleration versus the last three years. This projection doesn't excite us and suggests its products will face some demand challenges.
Unless you’ve been living under a rock, it should be obvious by now that generative AI is going to have a huge impact on how large corporations do business. While Nvidia and AMD are trading close to all-time highs, we prefer a lesser-known (but still profitable) stock benefiting from the rise of AI. Click here to access our free report one of our favorites growth stories.
Volume Growth
Revenue growth can be broken down into changes in price and volume (the number of units sold). While both are important, volume is the lifeblood of a successful staples business as there’s a ceiling to what consumers will pay for everyday goods; they can always trade down to non-branded products if the branded versions are too expensive.
To analyze whether PepsiCo generated its growth from changes in price or volume, we can compare its volume growth to its organic revenue growth, which excludes non-fundamental impacts on company financials like mergers and currency fluctuations.
Over the last two years, PepsiCo’s average quarterly sales volumes have shrunk by 2.3%. This decrease isn’t ideal as the quantity demanded for consumer staples products is typically stable. Luckily, PepsiCo was able to offset fewer customers purchasing its products by charging higher prices, enabling it to generate 3.1% average organic revenue growth. We hope the company can grow its volumes soon, however, as consistent price increases (on top of inflation) aren’t sustainable over the long term unless the business is really really special.
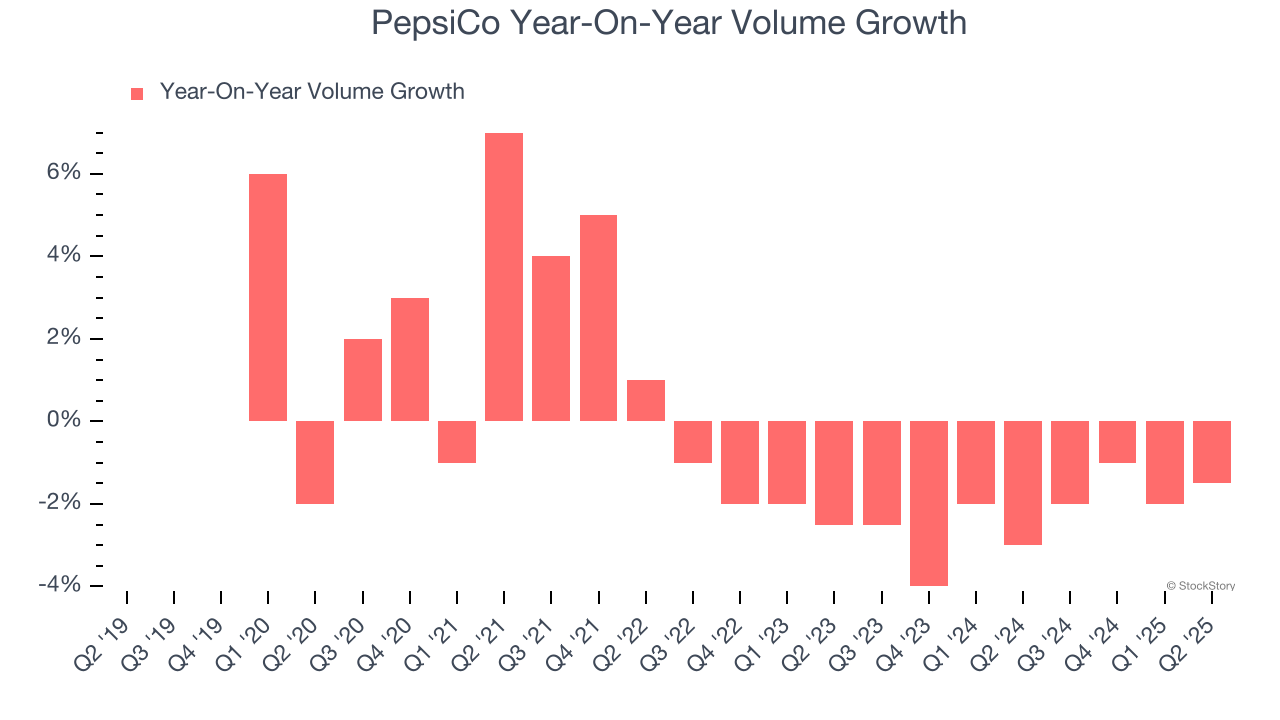
In PepsiCo’s Q2 2025, sales volumes dropped 1.5% year on year. This result represents a further deceleration from its historical levels, showing the business is struggling to move its products.
Key Takeaways from PepsiCo’s Q2 Results
It was encouraging to see PepsiCo beat analysts’ revenue expectations this quarter. We were also happy its organic revenue outperformed Wall Street’s estimates. Lastly, EPS beat. Overall, this was a solid quarter. The stock traded up 3.4% to $139.90 immediately after reporting.
So should you invest in PepsiCo right now? If you’re making that decision, you should consider the bigger picture of valuation, business qualities, as well as the latest earnings. We cover that in our actionable full research report which you can read here, it’s free.