
Regional bank Westamerica Bancorporation (NASDAQ: WABC) beat Wall Street’s revenue expectations in Q2 CY2025, but sales fell by 12.6% year on year to $64.88 million. Its GAAP profit of $1.12 per share was 4.7% above analysts’ consensus estimates.
Is now the time to buy Westamerica Bancorporation? Find out by accessing our full research report, it’s free.
Westamerica Bancorporation (WABC) Q2 CY2025 Highlights:
- Net Interest Income: $54.56 million vs analyst estimates of $54.12 million (14.4% year-on-year decline, 0.8% beat)
- Net Interest Margin: 3.9% vs analyst estimates of 3.9% (30 basis point year-on-year decrease, in line)
- Revenue: $64.88 million vs analyst estimates of $64.15 million (12.6% year-on-year decline, 1.1% beat)
- Efficiency Ratio: 39.3% vs analyst estimates of 38.6% (0.7 percentage point miss)
- EPS (GAAP): $1.12 vs analyst estimates of $1.07 (4.7% beat)
- Market Capitalization: $1.33 billion
Company Overview
Founded in 1884 and serving communities from Mendocino County in the north to Kern County in the south, Westamerica Bancorporation (NASDAQ: WABC) provides banking services to individuals and small businesses throughout Northern and Central California.
Sales Growth
Net interest income and and fee-based revenue are the two pillars supporting bank earnings. The former captures profit from the gap between lending rates and deposit costs, while the latter encompasses charges for banking services, credit products, wealth management, and trading activities.
Thankfully, Westamerica Bancorporation’s 6.1% annualized revenue growth over the last five years was decent. Its growth was slightly above the average bank company and shows its offerings resonate with customers.
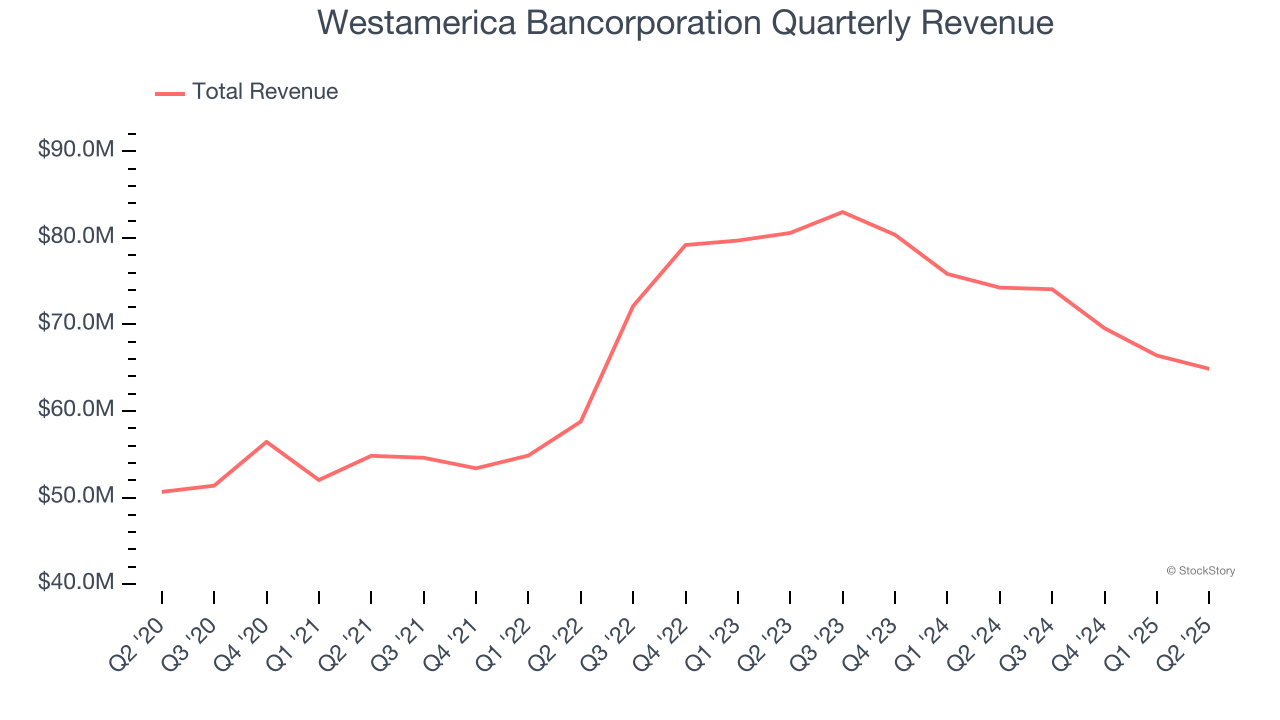
We at StockStory place the most emphasis on long-term growth, but within financials, a half-decade historical view may miss recent interest rate changes, market returns, and industry trends. Westamerica Bancorporation’s recent performance marks a sharp pivot from its five-year trend as its revenue has shown annualized declines of 6.1% over the last two years. 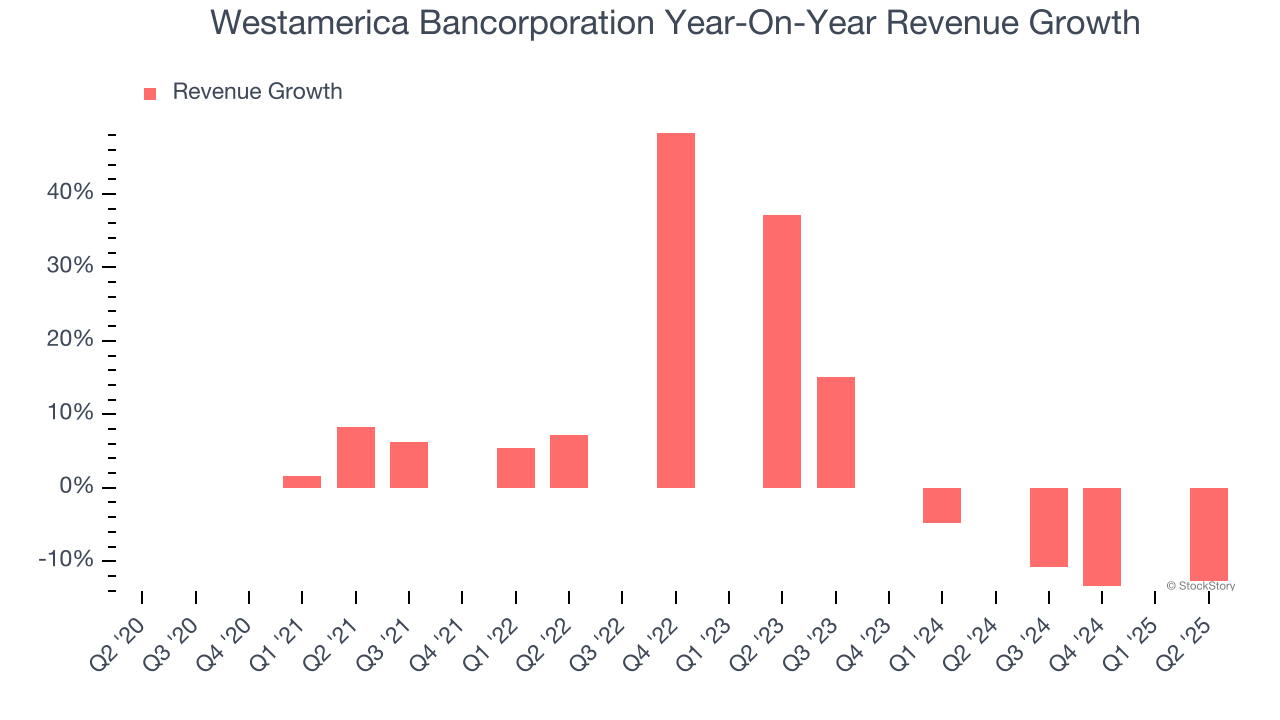 Note: Quarters not shown were determined to be outliers, impacted by outsized investment gains/losses that are not indicative of the recurring fundamentals of the business.
This quarter, Westamerica Bancorporation’s revenue fell by 12.6% year on year to $64.88 million but beat Wall Street’s estimates by 1.1%.
Net interest income made up 83% of the company’s total revenue during the last five years, meaning Westamerica Bancorporation barely relies on non-interest income to drive its overall growth.

Markets consistently prioritize net interest income growth over fee-based revenue, recognizing its superior quality and recurring nature compared to the more unpredictable non-interest income streams.
Today’s young investors won’t have read the timeless lessons in Gorilla Game: Picking Winners In High Technology because it was written more than 20 years ago when Microsoft and Apple were first establishing their supremacy. But if we apply the same principles, then enterprise software stocks leveraging their own generative AI capabilities may well be the Gorillas of the future. So, in that spirit, we are excited to present our Special Free Report on a profitable, fast-growing enterprise software stock that is already riding the automation wave and looking to catch the generative AI next.
Net Interest Income
Westamerica Bancorporation’s net interest income has grown at a 6.5% annualized rate over the last five years, slightly worse than the broader bank industry and in line with its total revenue.
When analyzing Westamerica Bancorporation’s net interest income over the last two years, we can see it did a 180 as income dropped by 7% annually.
From a unit economics perspective, we can see the company’s net interest margin averaged an excellent 4.1% over the past two years. However, its margin contracted by 4.3 basis points (100 basis points = 1 percentage point) over that period.
This decline was a headwind for its net interest income. While prevailing rates are a major determinant of net interest margin changes over time, the decline could mean Westamerica Bancorporation either faced competition for loans and deposits or experienced a negative mix shift in its balance sheet composition. One caveat is that net interest margins can also decrease to reflect lower default risk if banks begin making more conservative loans.
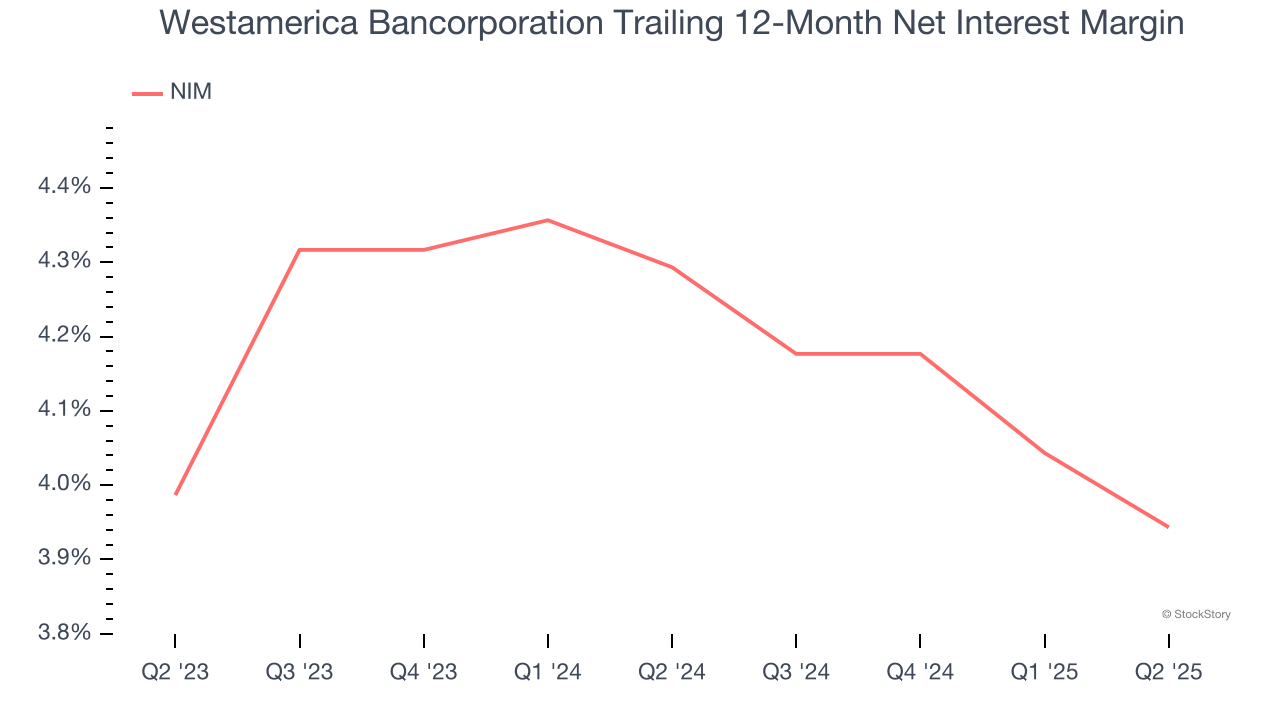
In Q2, Westamerica Bancorporation produced $54.56 million of net interest income, down 14.4% year on year. But this was still enough to meet Wall Street Consensus estimates. Net interest margin was 3.9%, meeting sell-side expectations.
Looking ahead, sell-side analysts expect net interest income to decline by 8.9% over the next 12 months, a slight deceleration versus the last two years.
Key Takeaways from Westamerica Bancorporation’s Q2 Results
It was good to see Westamerica Bancorporation narrowly top analysts’ revenue and net interest income expectations this quarter. We were also happy its EPS outperformed Wall Street’s estimates. Overall, this print had some key positives. The stock remained flat at $50.76 immediately after reporting.
So should you invest in Westamerica Bancorporation right now? The latest quarter does matter, but not nearly as much as longer-term fundamentals and valuation, when deciding if the stock is a buy. We cover that in our actionable full research report which you can read here, it’s free.