
Regional banking company Western Alliance Bancorporation (NYSE: WAL) reported revenue ahead of Wall Street’s expectations in Q2 CY2025, with sales up 9.7% year on year to $845.9 million. Its GAAP profit of $2.07 per share was 2.1% above analysts’ consensus estimates.
Is now the time to buy Western Alliance Bancorporation? Find out by accessing our full research report, it’s free.
Western Alliance Bancorporation (WAL) Q2 CY2025 Highlights:
- Net Interest Income: $697.6 million vs analyst estimates of $690.4 million (6.2% year-on-year growth, 1% beat)
- Net Interest Margin: 3.5% vs analyst estimates of 3.5% (10 basis point year-on-year decrease, in line)
- Revenue: $845.9 million vs analyst estimates of $830.1 million (9.7% year-on-year growth, 1.9% beat)
- Efficiency Ratio: 60.1% vs analyst estimates of 60.2% (in line)
- EPS (GAAP): $2.07 vs analyst estimates of $2.03 (2.1% beat)
- Market Capitalization: $9.00 billion
“Western Alliance delivered strong second quarter results featuring robust net interest income growth, continued loan and deposit momentum, and healthy earnings generated by improving profitability,” said Kenneth A. Vecchione, President and Chief Executive Officer.
Company Overview
Operating through five distinct regional banking divisions across the western United States, Western Alliance Bancorporation (NYSE: WAL) provides commercial banking, treasury management, mortgage services, and specialized financial solutions through its banking divisions and subsidiaries.
Sales Growth
In general, banks make money from two primary sources. The first is net interest income, which is interest earned on loans, mortgages, and investments in securities minus interest paid out on deposits. The second source is non-interest income, which can come from bank account, credit card, wealth management, investing banking, and trading fees.
Over the last five years, Western Alliance Bancorporation grew its revenue at an incredible 22.6% compounded annual growth rate. Its growth beat the average bank company and shows its offerings resonate with customers.
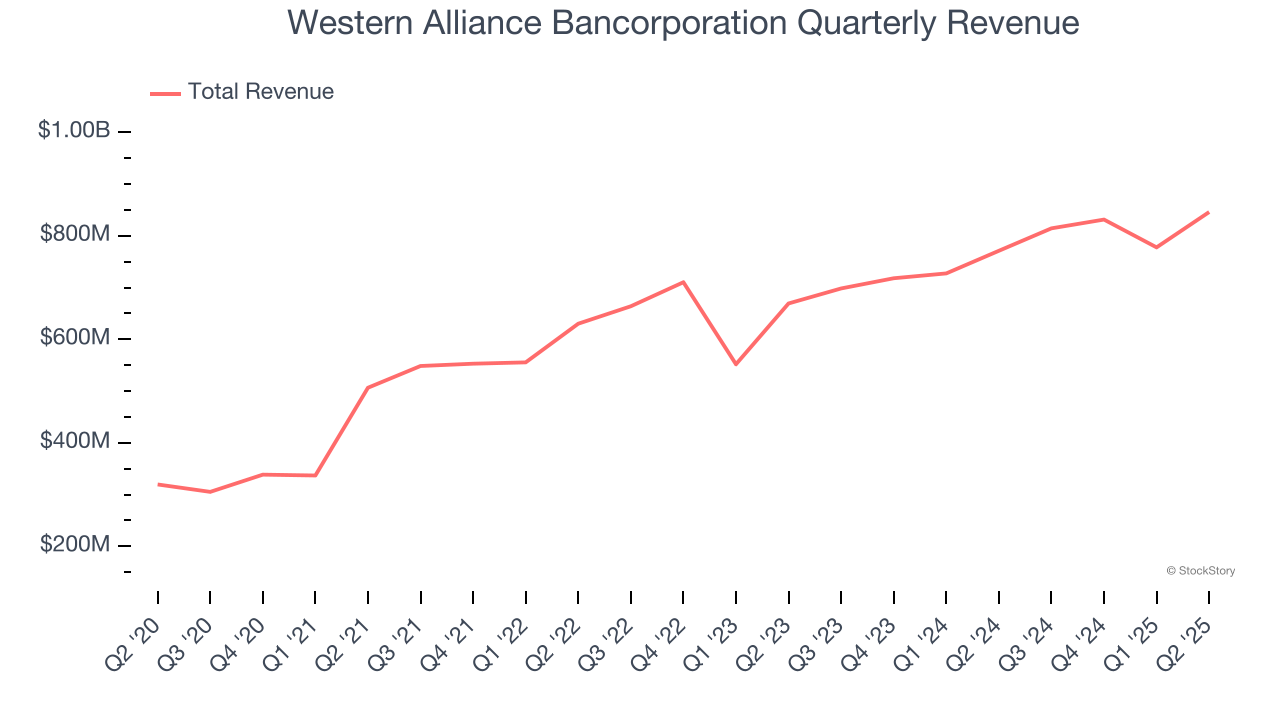
Long-term growth is the most important, but within financials, a half-decade historical view may miss recent interest rate changes and market returns. Western Alliance Bancorporation’s annualized revenue growth of 12.2% over the last two years is below its five-year trend, but we still think the results suggest healthy demand. 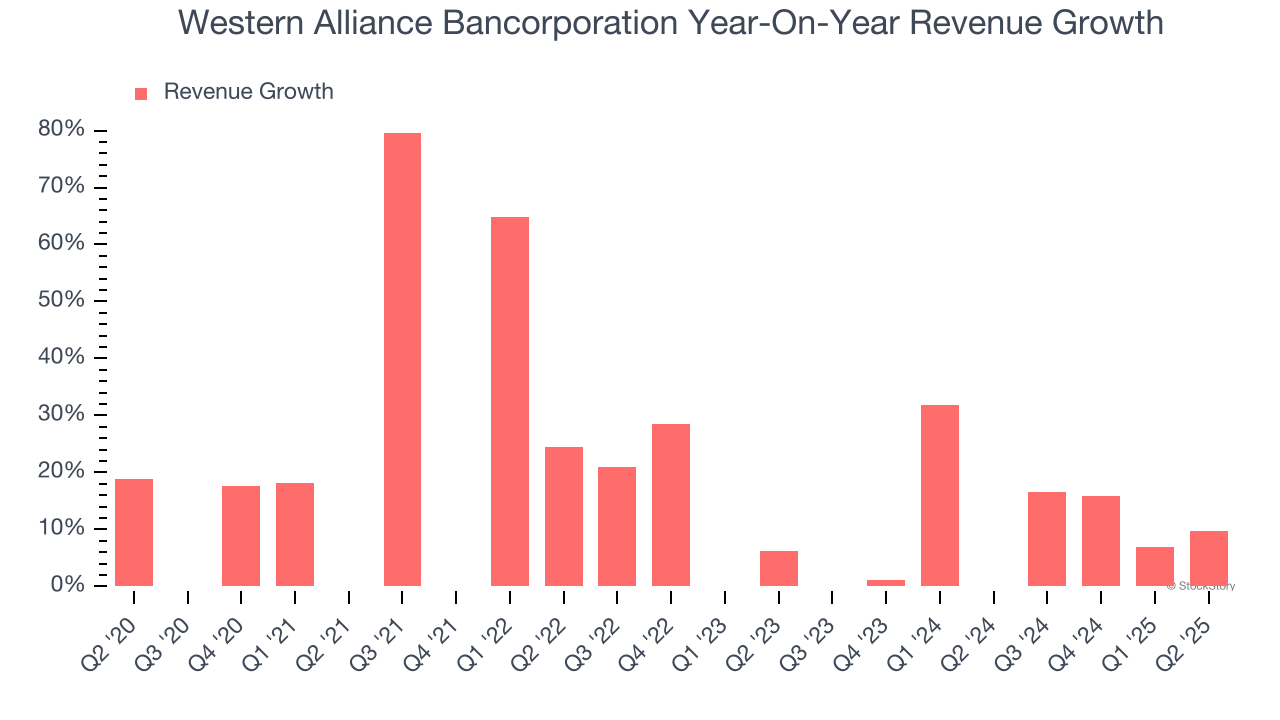 Note: Quarters not shown were determined to be outliers, impacted by outsized investment gains/losses that are not indicative of the recurring fundamentals of the business.
This quarter, Western Alliance Bancorporation reported year-on-year revenue growth of 9.7%, and its $845.9 million of revenue exceeded Wall Street’s estimates by 1.9%.
Net interest income made up 85.7% of the company’s total revenue during the last five years, meaning Western Alliance Bancorporation barely relies on non-interest income to drive its overall growth.
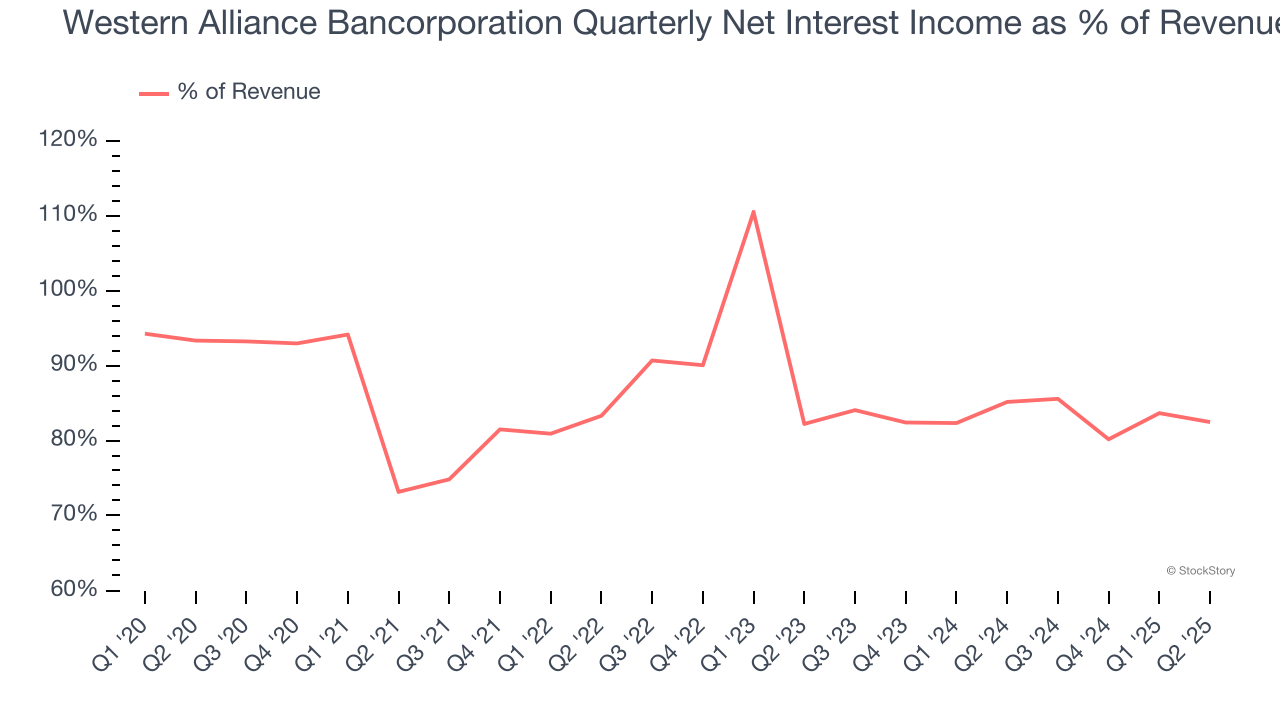
While banks generate revenue from multiple sources, investors view net interest income as the cornerstone - its predictable, recurring characteristics stand in sharp contrast to the volatility of non-interest income.
Unless you’ve been living under a rock, it should be obvious by now that generative AI is going to have a huge impact on how large corporations do business. While Nvidia and AMD are trading close to all-time highs, we prefer a lesser-known (but still profitable) stock benefiting from the rise of AI. Click here to access our free report one of our favorites growth stories.
Tangible Book Value Per Share (TBVPS)
Banks operate as balance sheet businesses, with profits generated through borrowing and lending activities. Valuations reflect this reality, emphasizing balance sheet strength and long-term book value compounding ability.
Because of this, tangible book value per share (TBVPS) emerges as the critical performance benchmark. By excluding intangible assets with uncertain liquidation values, this metric captures real, liquid net worth per share. On the other hand, EPS is often distorted by mergers and flexible loan loss accounting. TBVPS provides clearer performance insights.
Western Alliance Bancorporation’s TBVPS grew at an incredible 14.7% annual clip over the last five years. TBVPS growth has recently decelerated a bit to 13.4% annual growth over the last two years (from $43.42 to $55.87 per share).
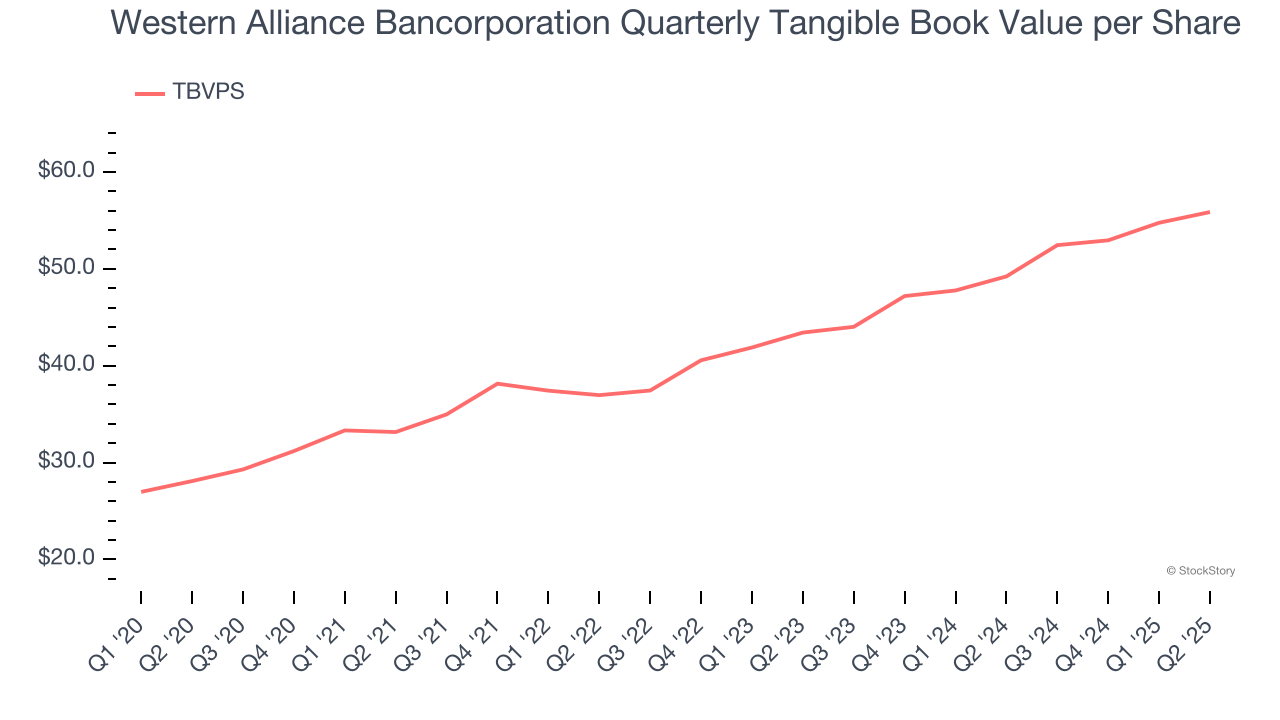
Over the next 12 months, Consensus estimates call for Western Alliance Bancorporation’s TBVPS to grow by 14.8% to $64.12, top-notch growth rate.
Key Takeaways from Western Alliance Bancorporation’s Q2 Results
It was encouraging to see Western Alliance Bancorporation beat analysts’ revenue, net interest income, and EPS expectations this quarter. Zooming out, we think this was a decent quarter. The stock traded up 1.1% to $85.50 immediately following the results.
So do we think Western Alliance Bancorporation is an attractive buy at the current price? When making that decision, it’s important to consider its valuation, business qualities, as well as what has happened in the latest quarter. We cover that in our actionable full research report which you can read here, it’s free.