
Cincinnati Financial trades at $149.03 and has moved in lockstep with the market. Its shares have returned 6.4% over the last six months while the S&P 500 has gained 4.1%.
Is CINF a buy right now? Find out in our full research report, it’s free.
Why Does Cincinnati Financial Spark Debate?
Founded in 1950 by independent insurance agents seeking stable market options for their clients, Cincinnati Financial (NASDAQ: CINF) provides property casualty insurance, life insurance, and related financial services through independent agencies across 46 states.
Two Positive Attributes:
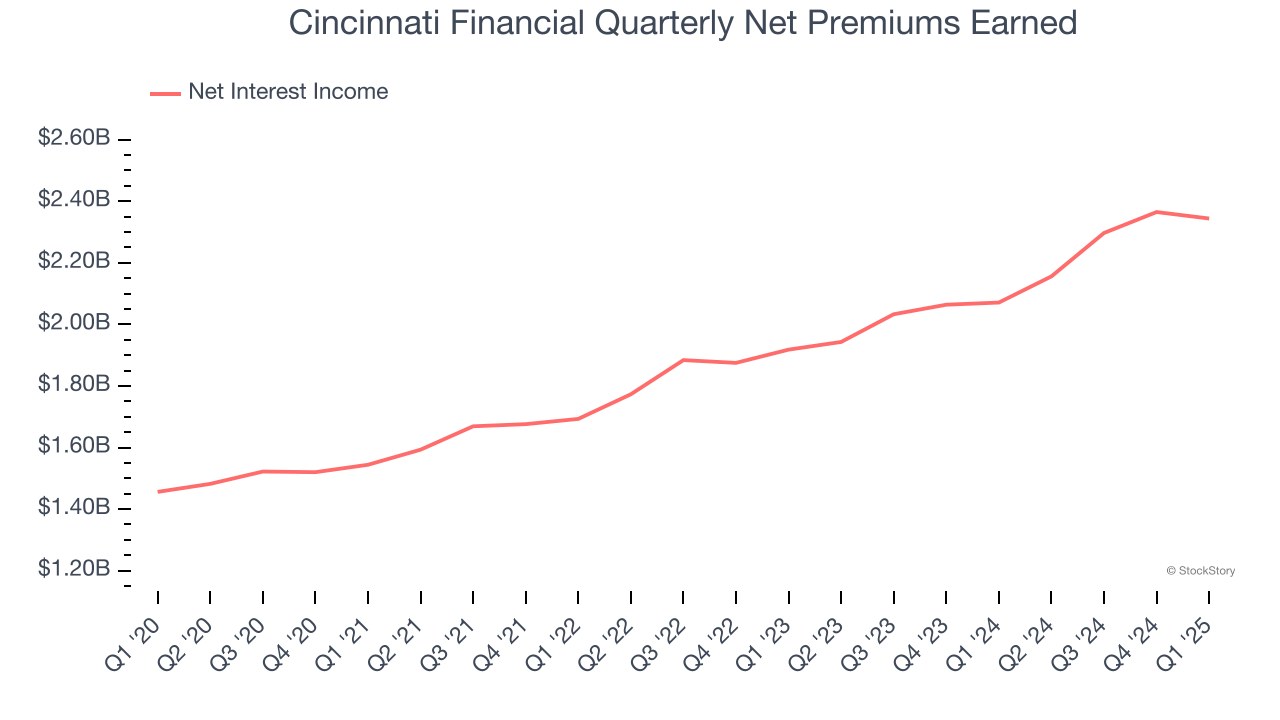
1. Net Premiums Earned Skyrockets, Fueling Growth Opportunities
Markets consistently prioritize net premiums earned growth over investment and fee income, recognizing its superior quality as a core indicator of the company’s underwriting success and market penetration.
Cincinnati Financial’s net premiums earned has grown at a 10.9% annualized rate over the last two years, better than the broader insurance industry.
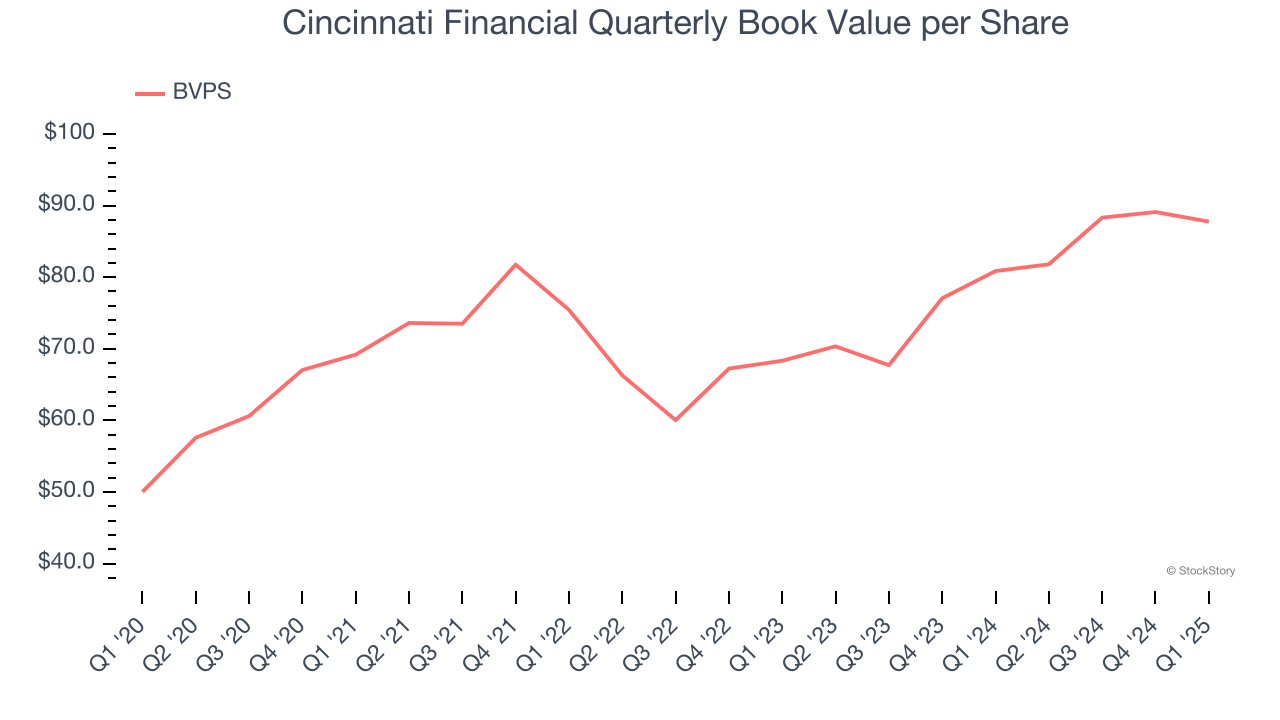
2. BVPS Growth Demonstrates Strong Asset Foundation
We consider book value per share (BVPS) a critical metric for insurance companies. BVPS represents the total net worth per share, providing insight into a company’s financial strength and ability to meet policyholder obligations.
Cincinnati Financial’s BVPS increased by 11.9% annually over the last five years, and growth has recently accelerated as BVPS grew at a decent 13.3% annual clip over the past two years (from $68.33 to $87.77 per share).
One Reason to be Careful:
Long-Term Revenue Growth Disappoints
Insurance companies earn revenue from three primary sources:
- The core insurance business itself, often called underwriting and represented in the income statement as premiums
- Income from investing the “float” (premiums collected upfront not yet paid out as claims) in assets such as fixed-income assets and equities
- Fees from various sources such as policy administration, annuities, or other value-added services
Over the last five years, Cincinnati Financial grew its revenue at a sluggish 2.7% compounded annual growth rate. This wasn’t a great result, but there are still things to like about Cincinnati Financial. 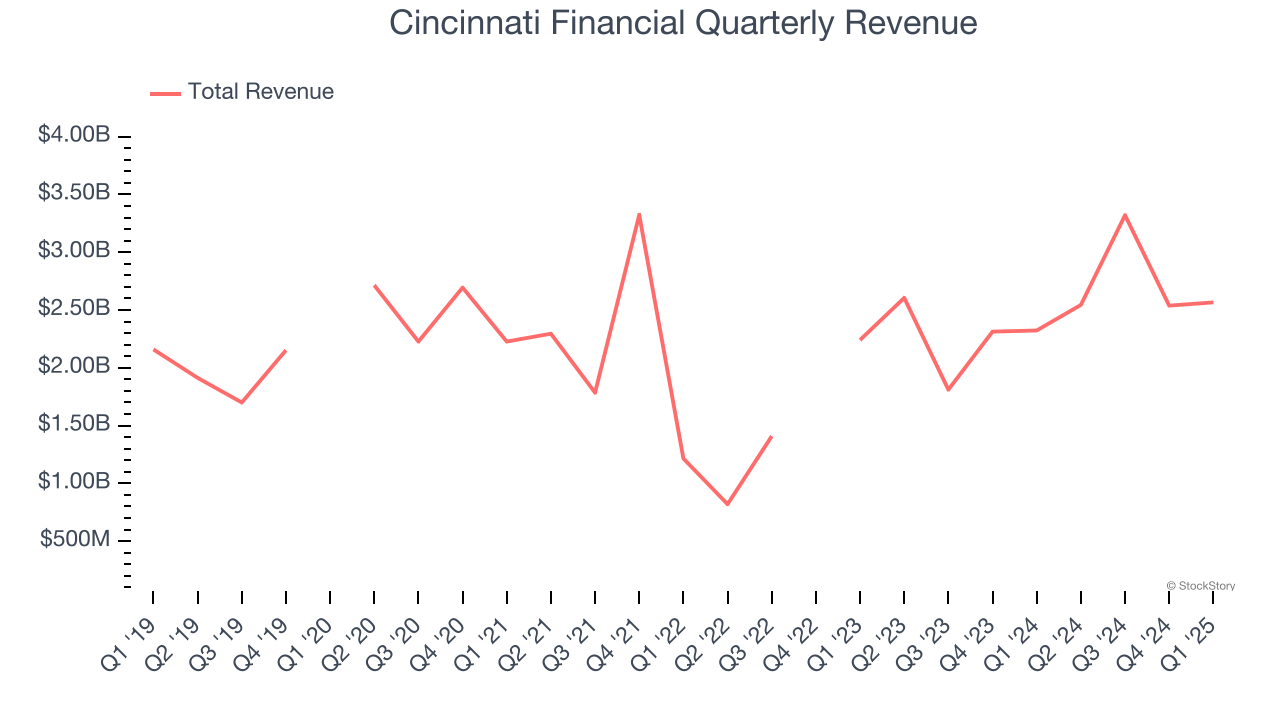 Note: Quarters not shown were determined to be outliers, impacted by outsized investment gains/losses that are not indicative of the recurring fundamentals of the business.
Final Judgment
Cincinnati Financial’s positive characteristics outweigh the negatives, but at $149.03 per share (or 1.6× forward P/B), is now the right time to buy the stock? See for yourself in our comprehensive research report, it’s free.
Stocks We Like Even More Than Cincinnati Financial
Donald Trump’s April 2024 "Liberation Day" tariffs sent markets into a tailspin, but stocks have since rebounded strongly, proving that knee-jerk reactions often create the best buying opportunities.
The smart money is already positioning for the next leg up. Don’t miss out on the recovery - check out our Top 9 Market-Beating Stocks. This is a curated list of our High Quality stocks that have generated a market-beating return of 183% over the last five years (as of March 31st 2025).
Stocks that made our list in 2020 include now familiar names such as Nvidia (+1,545% between March 2020 and March 2025) as well as under-the-radar businesses like the once-micro-cap company Tecnoglass (+1,754% five-year return). Find your next big winner with StockStory today.
StockStory is growing and hiring equity analyst and marketing roles. Are you a 0 to 1 builder passionate about the markets and AI? See the open roles here.


