Since January 2025, Primoris has been in a holding pattern, floating around $88.82.
Is now the time to buy PRIM? Or does the price properly account for its business quality and fundamentals? Find out in our full research report, it’s free.
Why Does Primoris Spark Debate?
Listed on the NASDAQ in 2008, Primoris (NYSE: PRIM) builds, maintains, and upgrades infrastructure in the utility, energy, and civil construction industries.
Two Things to Like:
1. Surging Backlog Locks In Future Sales
In addition to reported revenue, backlog is a useful data point for analyzing Construction and Maintenance Services companies. This metric shows the value of outstanding orders that have not yet been executed or delivered, giving visibility into Primoris’s future revenue streams.
Primoris’s backlog punched in at $11.4 billion in the latest quarter, and over the last two years, its year-on-year growth averaged 148%. This performance was fantastic and shows the company has a robust sales pipeline because it is accumulating more orders than it can fulfill. Its growth also suggests that customers are committing to Primoris for the long term, enhancing the business’s predictability. 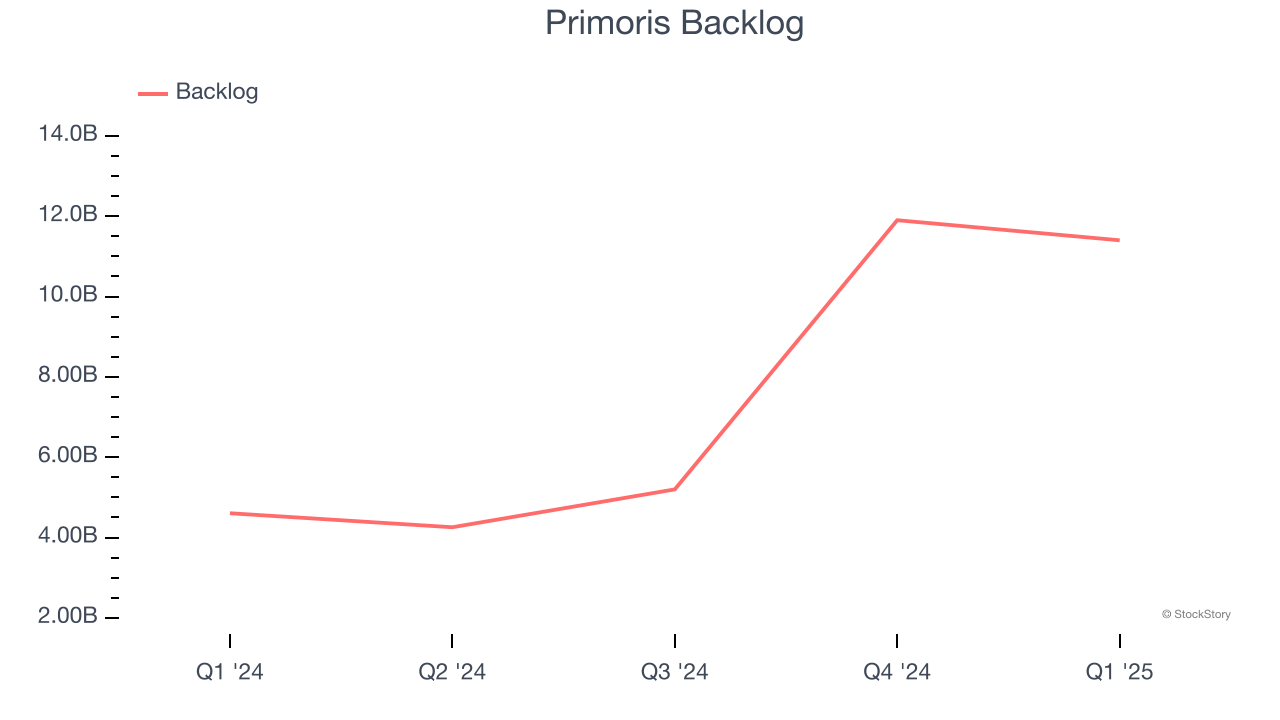
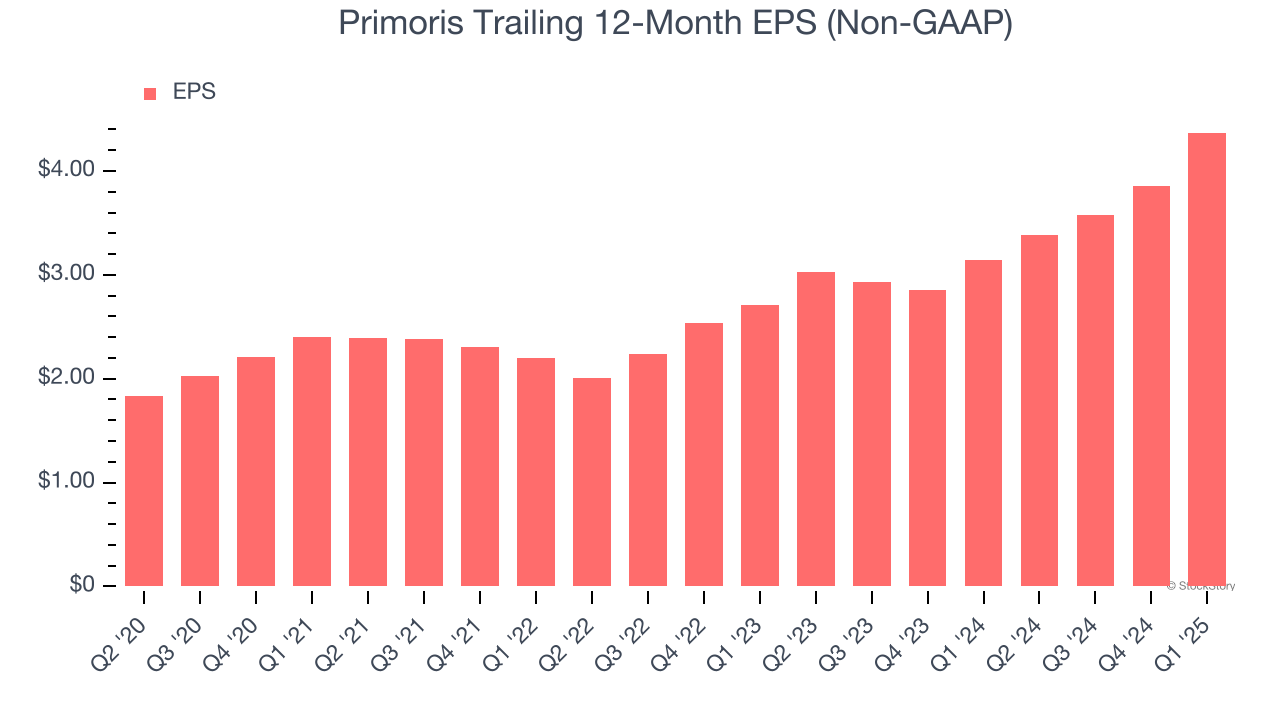
2. Outstanding Long-Term EPS Growth
Analyzing the long-term change in earnings per share (EPS) shows whether a company's incremental sales were profitable – for example, revenue could be inflated through excessive spending on advertising and promotions.
Primoris’s EPS grew at an astounding 23.7% compounded annual growth rate over the last five years, higher than its 15.7% annualized revenue growth. This tells us the company became more profitable on a per-share basis as it expanded.
One Reason to be Careful:
Low Gross Margin Reveals Weak Structural Profitability
All else equal, we prefer higher gross margins because they usually indicate that a company sells more differentiated products and commands stronger pricing power.
Primoris has bad unit economics for an industrials business, signaling it operates in a competitive market. As you can see below, it averaged a 10.9% gross margin over the last five years. Said differently, Primoris had to pay a chunky $89.11 to its suppliers for every $100 in revenue. 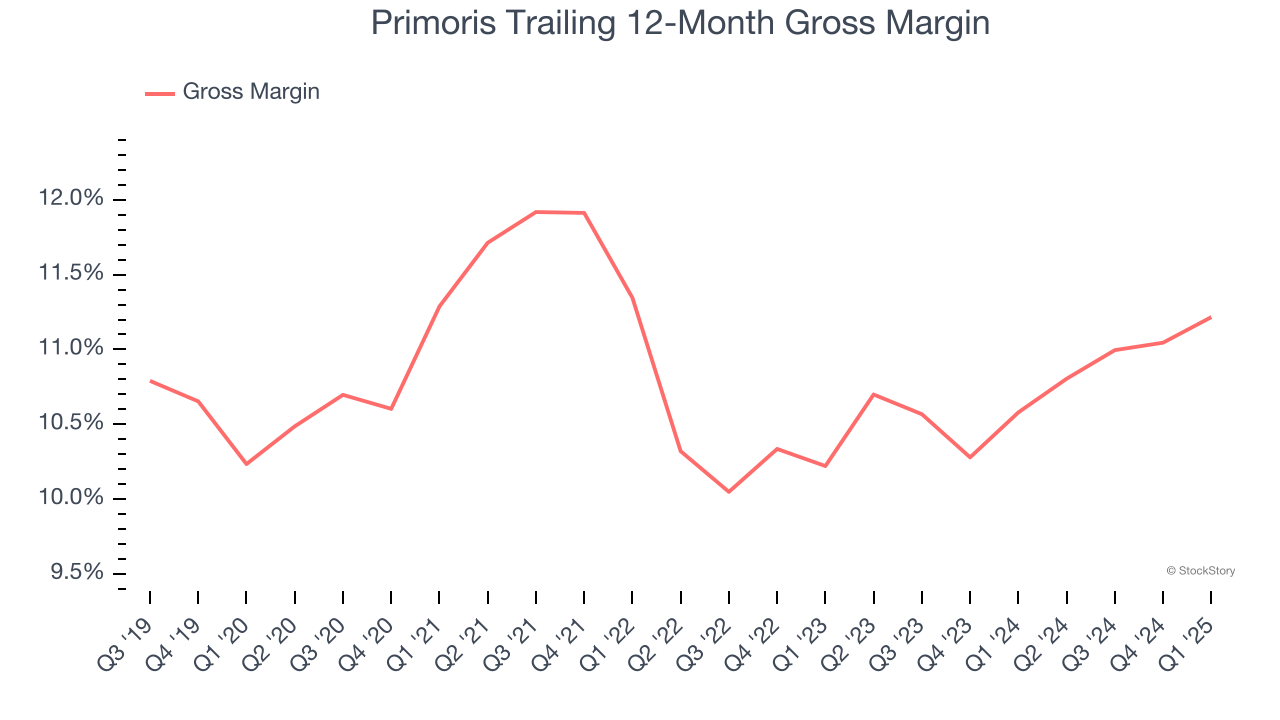
Final Judgment
Primoris’s positive characteristics outweigh the negatives, but at $88.82 per share (or 19.7× forward P/E), is now the right time to buy the stock? See for yourself in our comprehensive research report, it’s free.
Stocks We Like Even More Than Primoris
When Trump unveiled his aggressive tariff plan in April 2024, markets tanked as investors feared a full-blown trade war. But those who panicked and sold missed the subsequent rebound that’s already erased most losses.
Don’t let fear keep you from great opportunities and take a look at Top 5 Growth Stocks for this month. This is a curated list of our High Quality stocks that have generated a market-beating return of 183% over the last five years (as of March 31st 2025).
Stocks that made our list in 2020 include now familiar names such as Nvidia (+1,545% between March 2020 and March 2025) as well as under-the-radar businesses like the once-micro-cap company Tecnoglass (+1,754% five-year return). Find your next big winner with StockStory today.
StockStory is growing and hiring equity analyst and marketing roles. Are you a 0 to 1 builder passionate about the markets and AI? See the open roles here.