
Water control and measure company Badger Meter (NYSE: BMI) reported Q2 CY2025 results exceeding the market’s revenue expectations, with sales up 9.9% year on year to $238.1 million. Its GAAP profit of $1.17 per share was 2.2% below analysts’ consensus estimates.
Is now the time to buy Badger Meter? Find out by accessing our full research report, it’s free.
Badger Meter (BMI) Q2 CY2025 Highlights:
- Revenue: $238.1 million vs analyst estimates of $236.6 million (9.9% year-on-year growth, 0.6% beat)
- EPS (GAAP): $1.17 vs analyst expectations of $1.20 (2.2% miss)
- Operating Margin: 18.8%, in line with the same quarter last year
- Free Cash Flow Margin: 17.1%, up from 15.7% in the same quarter last year
- Market Capitalization: $7.22 billion
“We delivered strong sales growth, solid profitability and robust cash flow against last year's quarterly sales high-water mark," said Kenneth C. Bockhorst, Chairman, President and Chief Executive Officer.
Company Overview
The developer of the world’s first frost-proof water meter in 1905, Badger Meter (NYSE: BMI) provides water control and measure equipment to various industries.
Revenue Growth
Reviewing a company’s long-term sales performance reveals insights into its quality. Any business can put up a good quarter or two, but the best consistently grow over the long haul. Over the last five years, Badger Meter grew its sales at an incredible 16% compounded annual growth rate. Its growth surpassed the average industrials company and shows its offerings resonate with customers, a great starting point for our analysis.
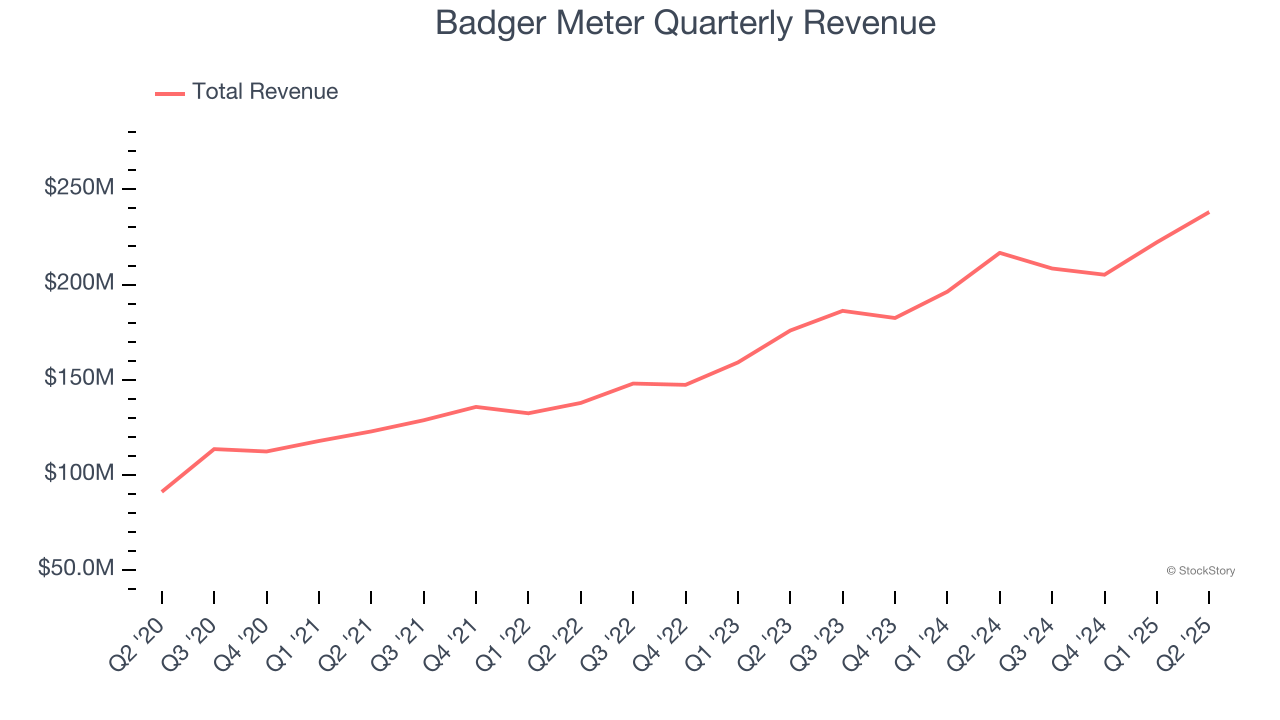
We at StockStory place the most emphasis on long-term growth, but within industrials, a half-decade historical view may miss cycles, industry trends, or a company capitalizing on catalysts such as a new contract win or a successful product line. Badger Meter’s annualized revenue growth of 17.8% over the last two years is above its five-year trend, suggesting its demand was strong and recently accelerated. Badger Meter’s recent performance shows it’s one of the better Inspection Instruments businesses as many of its peers faced declining sales because of cyclical headwinds. 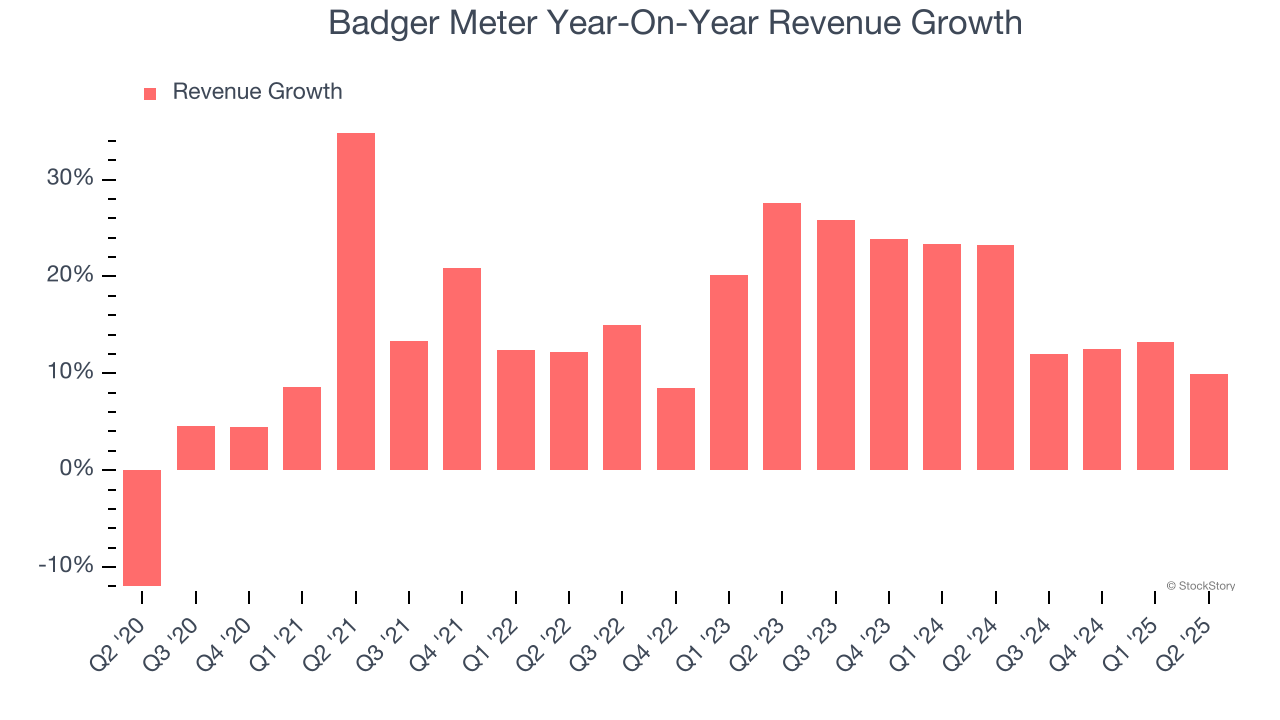
This quarter, Badger Meter reported year-on-year revenue growth of 9.9%, and its $238.1 million of revenue exceeded Wall Street’s estimates by 0.6%.
Looking ahead, sell-side analysts expect revenue to grow 10.9% over the next 12 months, a deceleration versus the last two years. Still, this projection is admirable and suggests the market sees success for its products and services.
Software is eating the world and there is virtually no industry left that has been untouched by it. That drives increasing demand for tools helping software developers do their jobs, whether it be monitoring critical cloud infrastructure, integrating audio and video functionality, or ensuring smooth content streaming. Click here to access a free report on our 3 favorite stocks to play this generational megatrend.
Operating Margin
Badger Meter has been a well-oiled machine over the last five years. It demonstrated elite profitability for an industrials business, boasting an average operating margin of 17.4%. This result isn’t surprising as its high gross margin gives it a favorable starting point.
Looking at the trend in its profitability, Badger Meter’s operating margin rose by 4.3 percentage points over the last five years, as its sales growth gave it operating leverage.
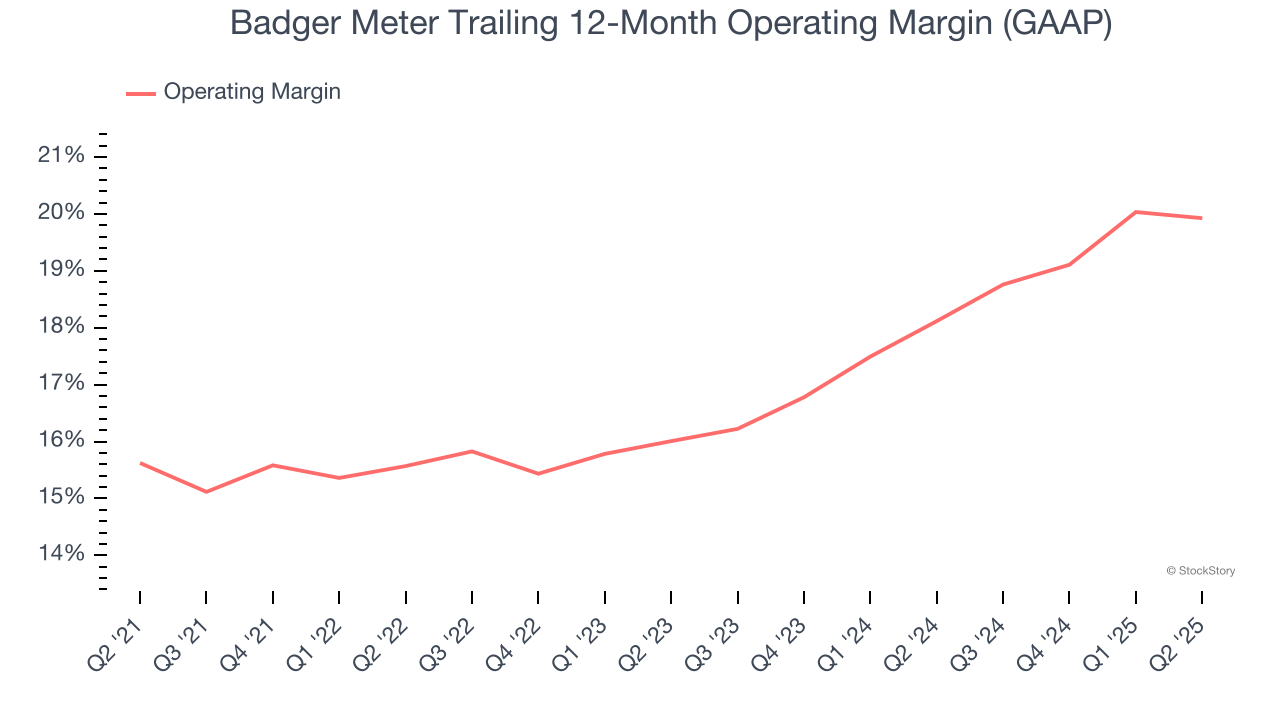
In Q2, Badger Meter generated an operating margin profit margin of 18.8%, in line with the same quarter last year. This indicates the company’s cost structure has recently been stable.
Earnings Per Share
We track the long-term change in earnings per share (EPS) for the same reason as long-term revenue growth. Compared to revenue, however, EPS highlights whether a company’s growth is profitable.
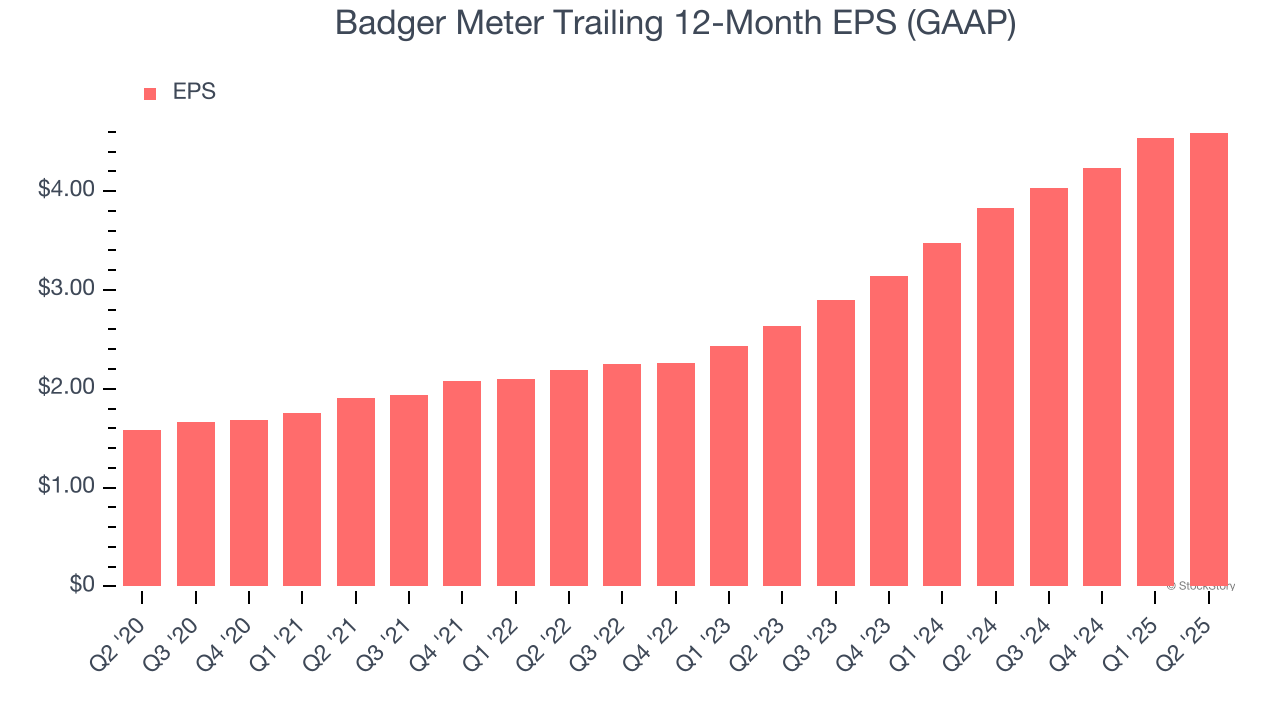
Badger Meter’s EPS grew at an astounding 23.7% compounded annual growth rate over the last five years, higher than its 16% annualized revenue growth. This tells us the company became more profitable on a per-share basis as it expanded.
Diving into the nuances of Badger Meter’s earnings can give us a better understanding of its performance. As we mentioned earlier, Badger Meter’s operating margin was flat this quarter but expanded by 4.3 percentage points over the last five years. This was the most relevant factor (aside from the revenue impact) behind its higher earnings; interest expenses and taxes can also affect EPS but don’t tell us as much about a company’s fundamentals.
Like with revenue, we analyze EPS over a more recent period because it can provide insight into an emerging theme or development for the business.
For Badger Meter, its two-year annual EPS growth of 32.1% was higher than its five-year trend. We love it when earnings growth accelerates, especially when it accelerates off an already high base.
In Q2, Badger Meter reported EPS at $1.17, up from $1.12 in the same quarter last year. Despite growing year on year, this print missed analysts’ estimates, but we care more about long-term EPS growth than short-term movements. Over the next 12 months, Wall Street expects Badger Meter’s full-year EPS of $4.59 to grow 10.7%.
Key Takeaways from Badger Meter’s Q2 Results
It was good to see Badger Meter narrowly top analysts’ revenue expectations this quarter. On the other hand, its EPS missed. Overall, this was a weaker quarter. The stock traded down 6% to $230.87 immediately after reporting.
The latest quarter from Badger Meter’s wasn’t that good. One earnings report doesn’t define a company’s quality, though, so let’s explore whether the stock is a buy at the current price. What happened in the latest quarter matters, but not as much as longer-term business quality and valuation, when deciding whether to invest in this stock. We cover that in our actionable full research report which you can read here, it’s free.


