Wynn Resorts has had an impressive run over the past six months as its shares have beaten the S&P 500 by 23.5%. The stock now trades at $107.72, marking a 26.6% gain. This run-up might have investors contemplating their next move.
Is there a buying opportunity in Wynn Resorts, or does it present a risk to your portfolio? Check out our in-depth research report to see what our analysts have to say, it’s free.
Why Is Wynn Resorts Not Exciting?
Despite the momentum, we're swiping left on Wynn Resorts for now. Here are three reasons why you should be careful with WYNN and a stock we'd rather own.
1. Long-Term Revenue Growth Disappoints
A company’s long-term sales performance can indicate its overall quality. Even a bad business can shine for one or two quarters, but a top-tier one grows for years. Regrettably, Wynn Resorts’s sales grew at a sluggish 3.3% compounded annual growth rate over the last five years. This was below our standard for the consumer discretionary sector. 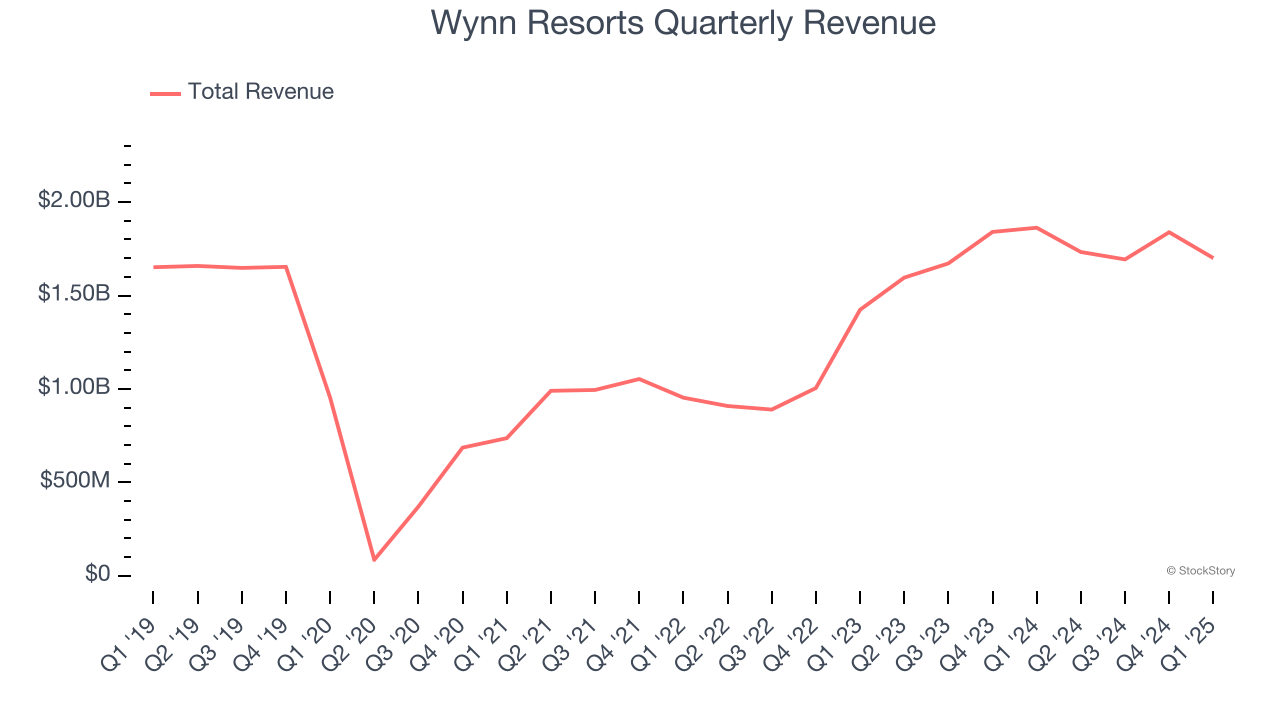
2. Previous Growth Initiatives Haven’t Impressed
Growth gives us insight into a company’s long-term potential, but how capital-efficient was that growth? Enter ROIC, a metric showing how much operating profit a company generates relative to the money it has raised (debt and equity).
Wynn Resorts historically did a mediocre job investing in profitable growth initiatives. Its five-year average ROIC was 1.9%, lower than the typical cost of capital (how much it costs to raise money) for consumer discretionary companies.
3. High Debt Levels Increase Risk
Debt is a tool that can boost company returns but presents risks if used irresponsibly. As long-term investors, we aim to avoid companies taking excessive advantage of this instrument because it could lead to insolvency.
Wynn Resorts’s $12.18 billion of debt exceeds the $2.07 billion of cash on its balance sheet. Furthermore, its 5× net-debt-to-EBITDA ratio (based on its EBITDA of $1.90 billion over the last 12 months) shows the company is overleveraged.
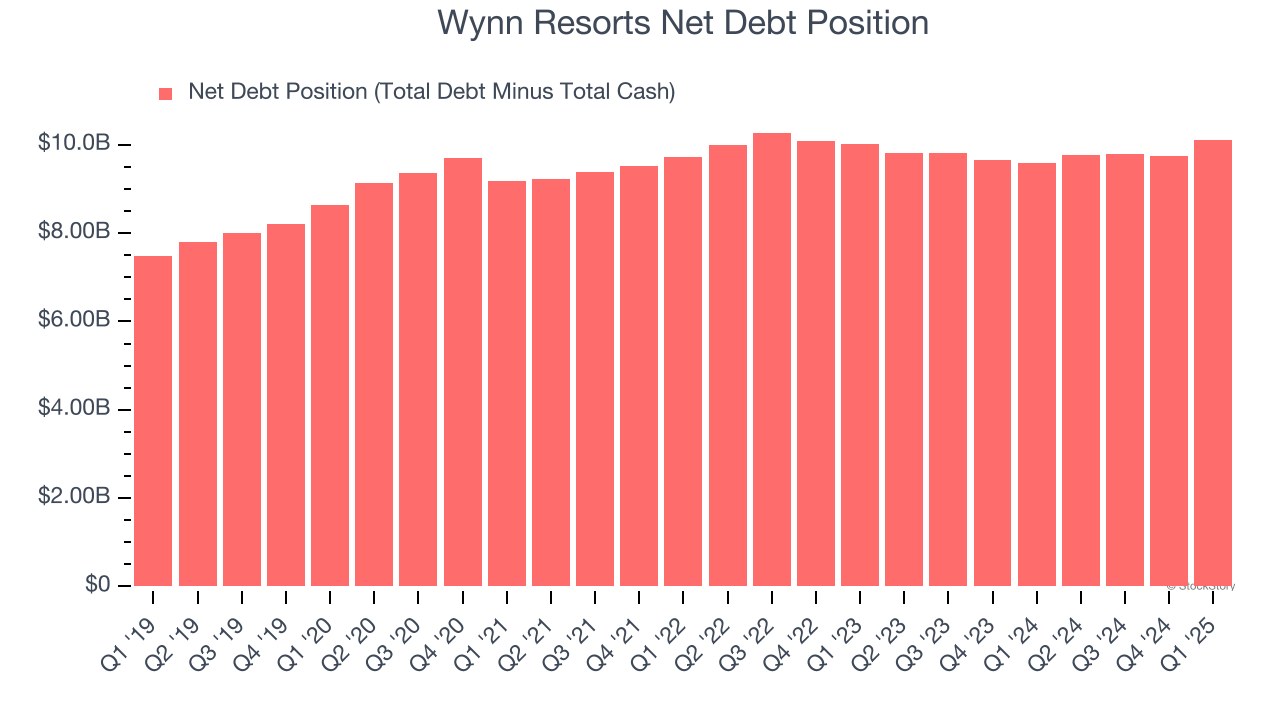
At this level of debt, incremental borrowing becomes increasingly expensive and credit agencies could downgrade the company’s rating if profitability falls. Wynn Resorts could also be backed into a corner if the market turns unexpectedly – a situation we seek to avoid as investors in high-quality companies.
We hope Wynn Resorts can improve its balance sheet and remain cautious until it increases its profitability or pays down its debt.
Final Judgment
Wynn Resorts isn’t a terrible business, but it doesn’t pass our bar. With its shares outperforming the market lately, the stock trades at 21.9× forward P/E (or $107.72 per share). This valuation is reasonable, but the company’s shakier fundamentals present too much downside risk. We're fairly confident there are better stocks to buy right now. We’d suggest looking at the Amazon and PayPal of Latin America.
High-Quality Stocks for All Market Conditions
Trump’s April 2024 tariff bombshell triggered a massive market selloff, but stocks have since staged an impressive recovery, leaving those who panic sold on the sidelines.
Take advantage of the rebound by checking out our Top 9 Market-Beating Stocks. This is a curated list of our High Quality stocks that have generated a market-beating return of 183% over the last five years (as of March 31st 2025).
Stocks that made our list in 2020 include now familiar names such as Nvidia (+1,545% between March 2020 and March 2025) as well as under-the-radar businesses like the once-small-cap company Exlservice (+354% five-year return). Find your next big winner with StockStory today.
StockStory is growing and hiring equity analyst and marketing roles. Are you a 0 to 1 builder passionate about the markets and AI? See the open roles here.