
Regional banking company Brookline Bancorp (NASDAQ: BRKL) missed Wall Street’s revenue expectations in Q2 CY2025, but sales rose 9.6% year on year to $94.66 million. Its GAAP profit of $0.25 per share was in line with analysts’ consensus estimates.
Is now the time to buy Brookline Bancorp? Find out by accessing our full research report, it’s free.
Brookline Bancorp (BRKL) Q2 CY2025 Highlights:
- Net Interest Income: $88.69 million vs analyst estimates of $89.57 million (10.9% year-on-year growth, 1% miss)
- Net Interest Margin: 3.3% vs analyst estimates of 3.3% (32 basis point year-on-year increase, 4.3 bps beat)
- Revenue: $94.66 million vs analyst estimates of $95.43 million (9.6% year-on-year growth, 0.8% miss)
- Efficiency Ratio: 61.3% vs analyst estimates of 63.8% (2.5 percentage point beat)
- EPS (GAAP): $0.25 vs analyst estimates of $0.25 (in line)
- Market Capitalization: $986.4 million
Company Overview
Founded in 1871 and operating through three subsidiary banks across three states, Brookline Bancorp (NASDAQ: BRKL) is a multi-bank holding company that provides commercial, business, and retail banking services to small and mid-sized businesses and individuals in New England and New York.
Sales Growth
Two primary revenue streams drive bank earnings. While net interest income, which is earned by charging higher rates on loans than paid on deposits, forms the foundation, fee-based services across banking, credit, wealth management, and trading operations provide additional income.
Over the last five years, Brookline Bancorp grew its revenue at a decent 5.2% compounded annual growth rate. Its growth was slightly above the average bank company and shows its offerings resonate with customers.
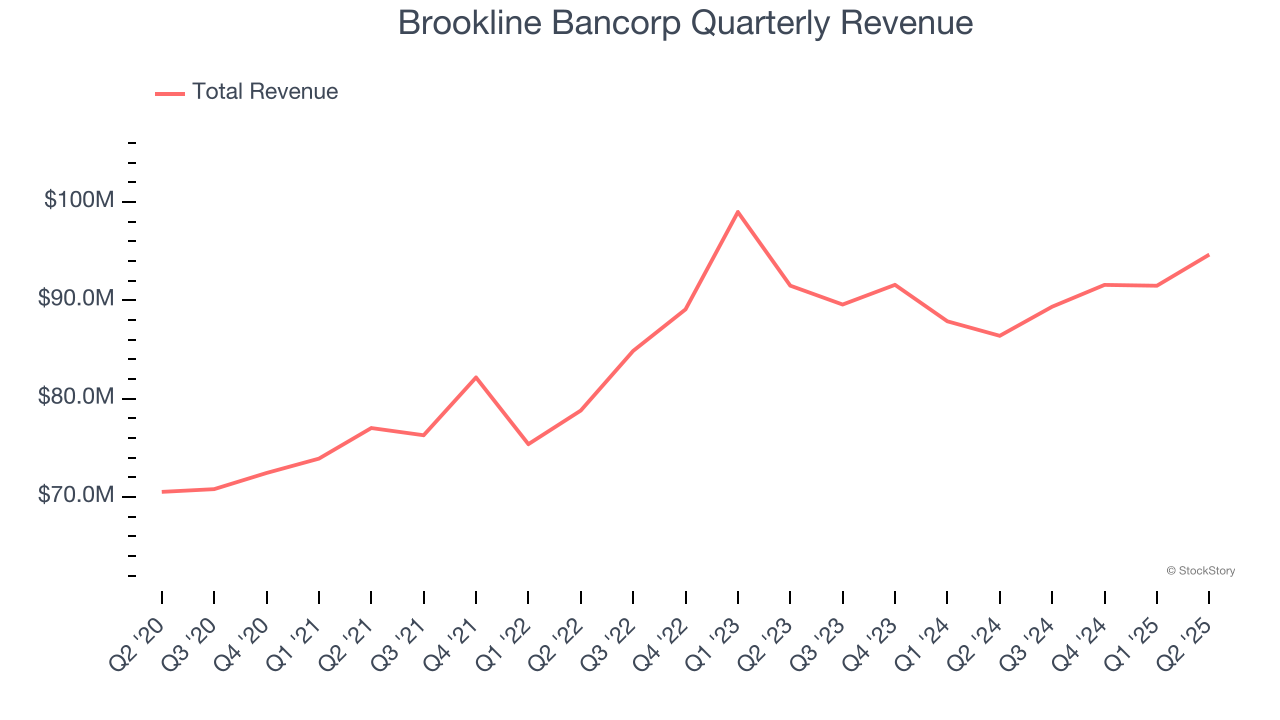
We at StockStory place the most emphasis on long-term growth, but within financials, a half-decade historical view may miss recent interest rate changes, market returns, and industry trends. Brookline Bancorp’s recent performance shows its demand has slowed as its revenue was flat over the last two years. 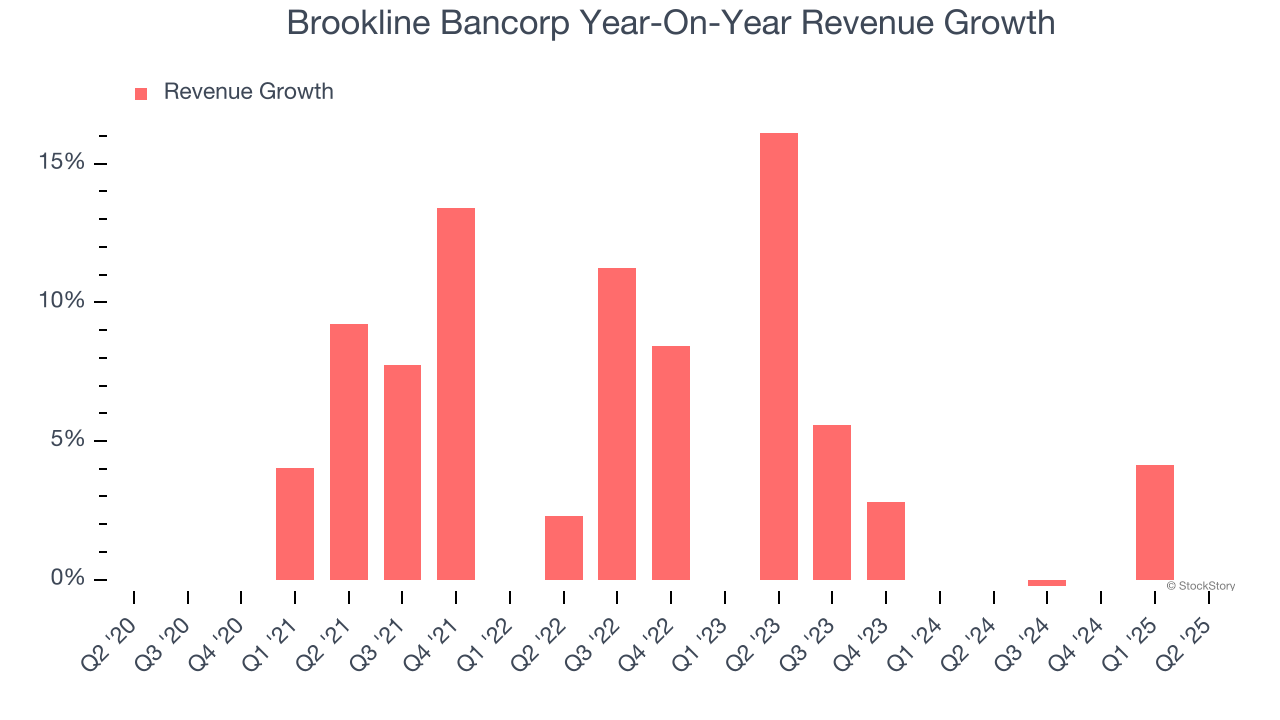 Note: Quarters not shown were determined to be outliers, impacted by outsized investment gains/losses that are not indicative of the recurring fundamentals of the business.
This quarter, Brookline Bancorp’s revenue grew by 9.6% year on year to $94.66 million, missing Wall Street’s estimates.
Net interest income made up 92.2% of the company’s total revenue during the last five years, meaning Brookline Bancorp lives and dies by its lending activities because non-interest income barely moves the needle.
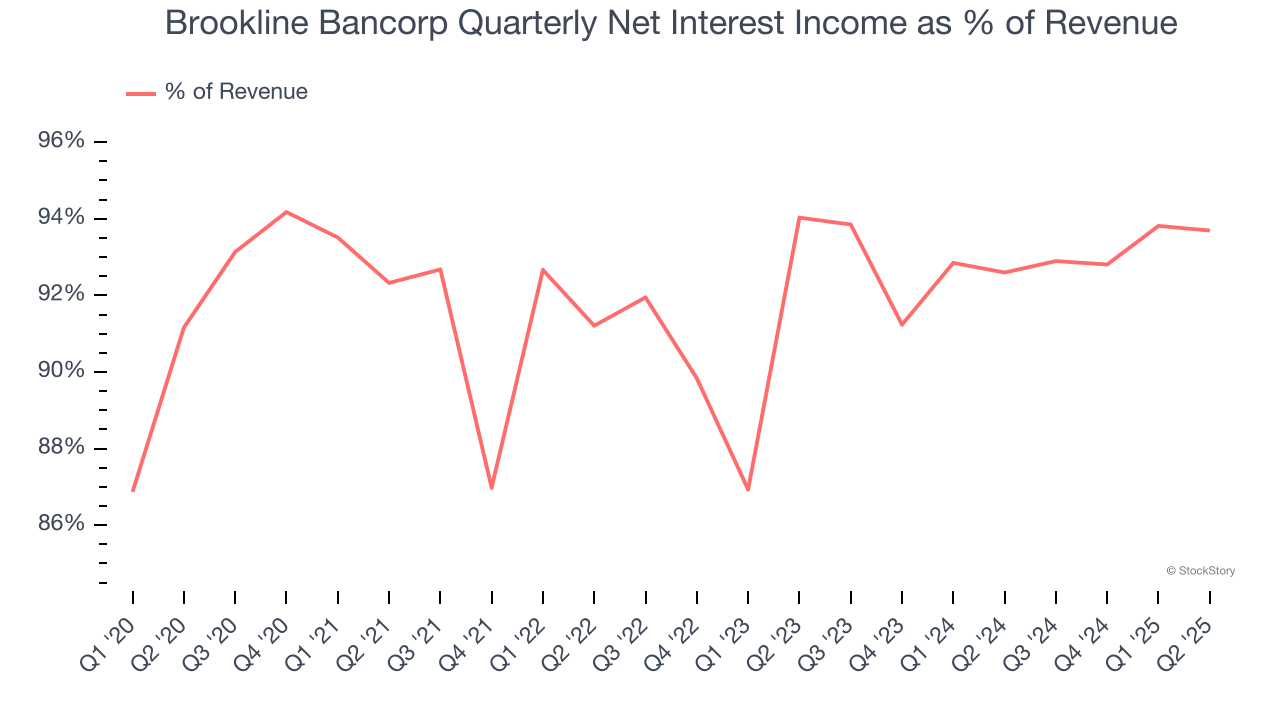
While banks generate revenue from multiple sources, investors view net interest income as the cornerstone - its predictable, recurring characteristics stand in sharp contrast to the volatility of non-interest income.
Unless you’ve been living under a rock, it should be obvious by now that generative AI is going to have a huge impact on how large corporations do business. While Nvidia and AMD are trading close to all-time highs, we prefer a lesser-known (but still profitable) stock benefiting from the rise of AI. Click here to access our free report one of our favorites growth stories.
Tangible Book Value Per Share (TBVPS)
Banks are balance sheet-driven businesses because they generate earnings primarily through borrowing and lending. They’re also valued based on their balance sheet strength and ability to compound book value (another name for shareholders’ equity) over time.
Because of this, tangible book value per share (TBVPS) emerges as the critical performance benchmark. By excluding intangible assets with uncertain liquidation values, this metric captures real, liquid net worth per share. EPS can become murky due to acquisition impacts or accounting flexibility around loan provisions, and TBVPS resists financial engineering manipulation.
Brookline Bancorp’s TBVPS grew at a sluggish 2.9% annual clip over the last five years. However, TBVPS growth has accelerated recently, growing by 5.5% annually over the last two years from $10.07 to $11.20 per share.
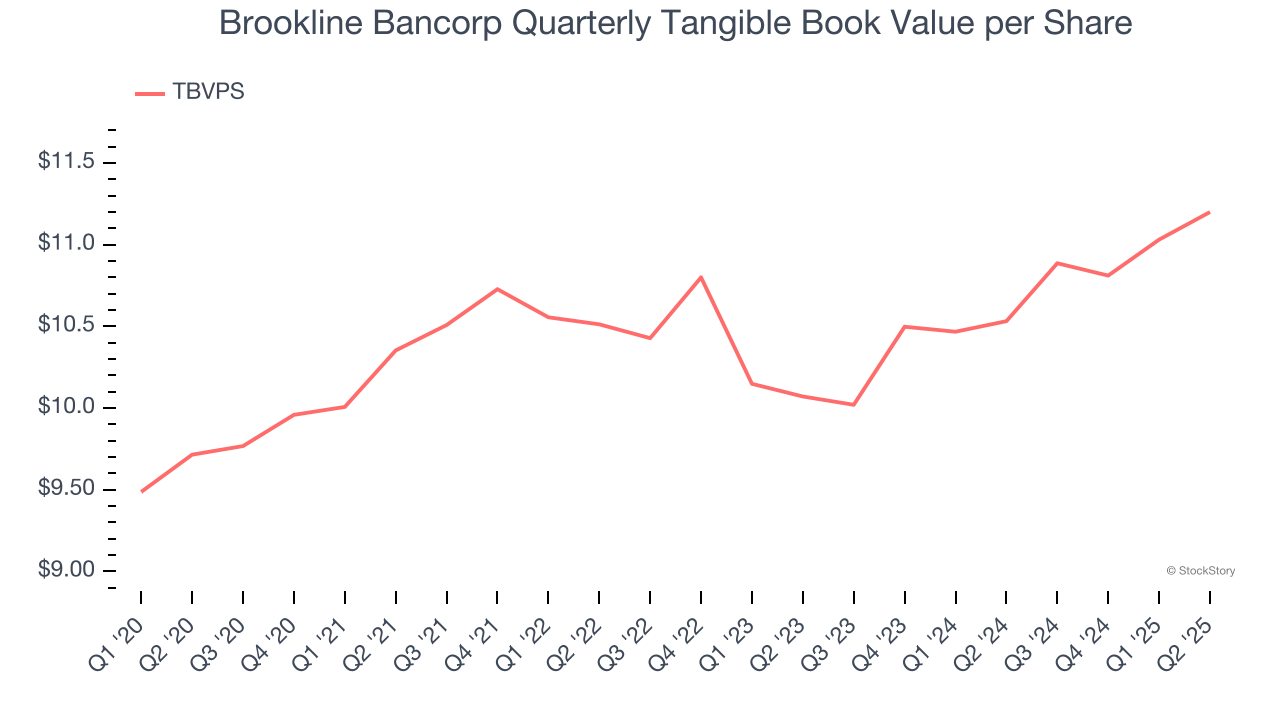
Over the next 12 months, Consensus estimates call for Brookline Bancorp’s TBVPS to grow by 46.9% to $16.46, elite growth rate.
Key Takeaways from Brookline Bancorp’s Q2 Results
We struggled to find many positives in these results as its net interest income slightly missed Wall Street’s estimates. Overall, this was a softer quarter. The stock remained flat at $11 immediately following the results.
Big picture, is Brookline Bancorp a buy here and now? What happened in the latest quarter matters, but not as much as longer-term business quality and valuation, when deciding whether to invest in this stock. We cover that in our actionable full research report which you can read here, it’s free.