
Regional banking company Cadence Bank (NYSE: CADE) reported Q2 CY2025 results topping the market’s revenue expectations, with sales up 7.6% year on year to $476.3 million. Its non-GAAP profit of $0.73 per share was 6.9% above analysts’ consensus estimates.
Is now the time to buy Cadence Bank? Find out by accessing our full research report, it’s free.
Cadence Bank (CADE) Q2 CY2025 Highlights:
- Net Interest Income: $378.1 million vs analyst estimates of $377.2 million (6.1% year-on-year growth, in line)
- Net Interest Margin: 3.4% vs analyst estimates of 3.5% (13 basis point year-on-year increase, 6.5 bps miss)
- Revenue: $476.3 million vs analyst estimates of $468.3 million (7.6% year-on-year growth, 1.7% beat)
- Efficiency Ratio: 57.2% vs analyst estimates of 57.9% (0.7 percentage point beat)
- Adjusted EPS: $0.73 vs analyst estimates of $0.68 (6.9% beat)
- Market Capitalization: $6.61 billion
Company Overview
With roots dating back to 1885 and a strategic focus on middle-market commercial lending, Cadence Bancorporation (NYSE: CADE) is a bank holding company that provides commercial banking, retail banking, and wealth management services to middle-market businesses and individuals.
Sales Growth
In general, banks make money from two primary sources. The first is net interest income, which is interest earned on loans, mortgages, and investments in securities minus interest paid out on deposits. The second source is non-interest income, which can come from bank account, credit card, wealth management, investing banking, and trading fees.
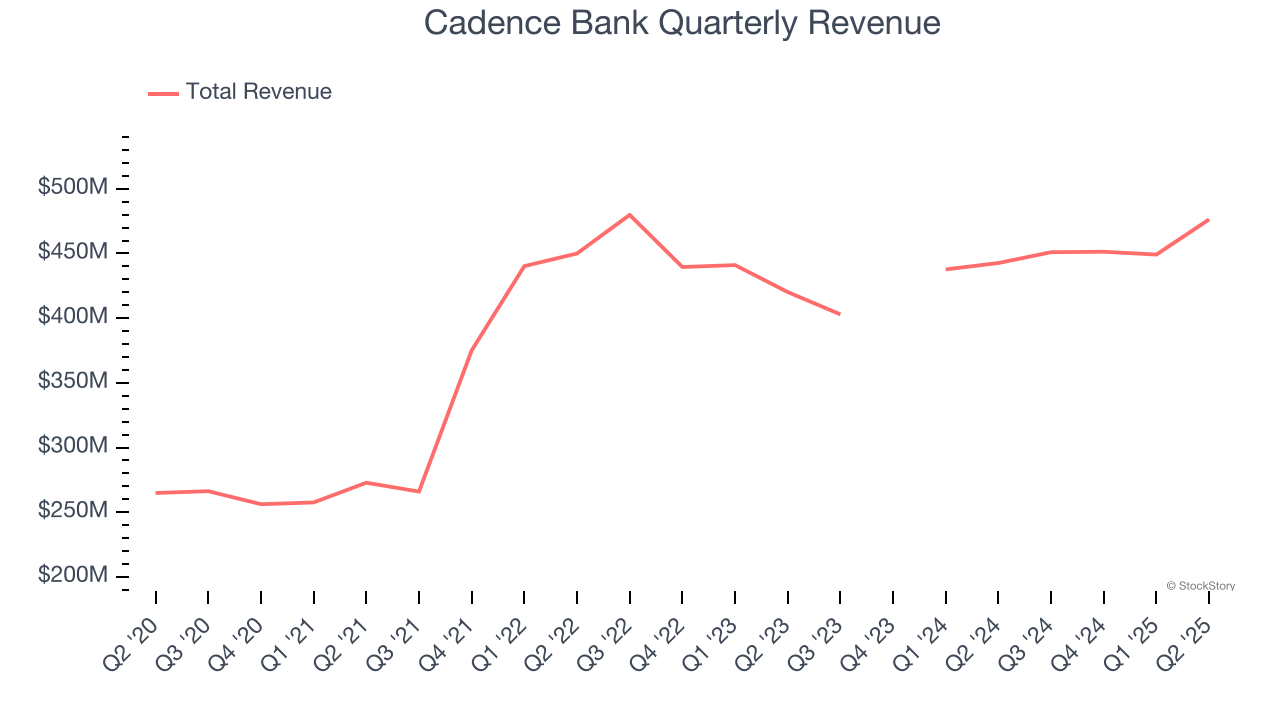
Luckily, Cadence Bank’s revenue grew at an excellent 12.7% compounded annual growth rate over the last five years. Its growth beat the average bank company and shows its offerings resonate with customers, a helpful starting point for our analysis.
 Note: Quarters not shown were determined to be outliers, impacted by outsized investment gains/losses that are not indicative of the recurring fundamentals of the business.
We at StockStory place the most emphasis on long-term growth, but within financials, a half-decade historical view may miss recent interest rate changes, market returns, and industry trends. Cadence Bank’s recent performance shows its demand has slowed significantly as its annualized revenue growth of 1.3% over the last two years was well below its five-year trend. 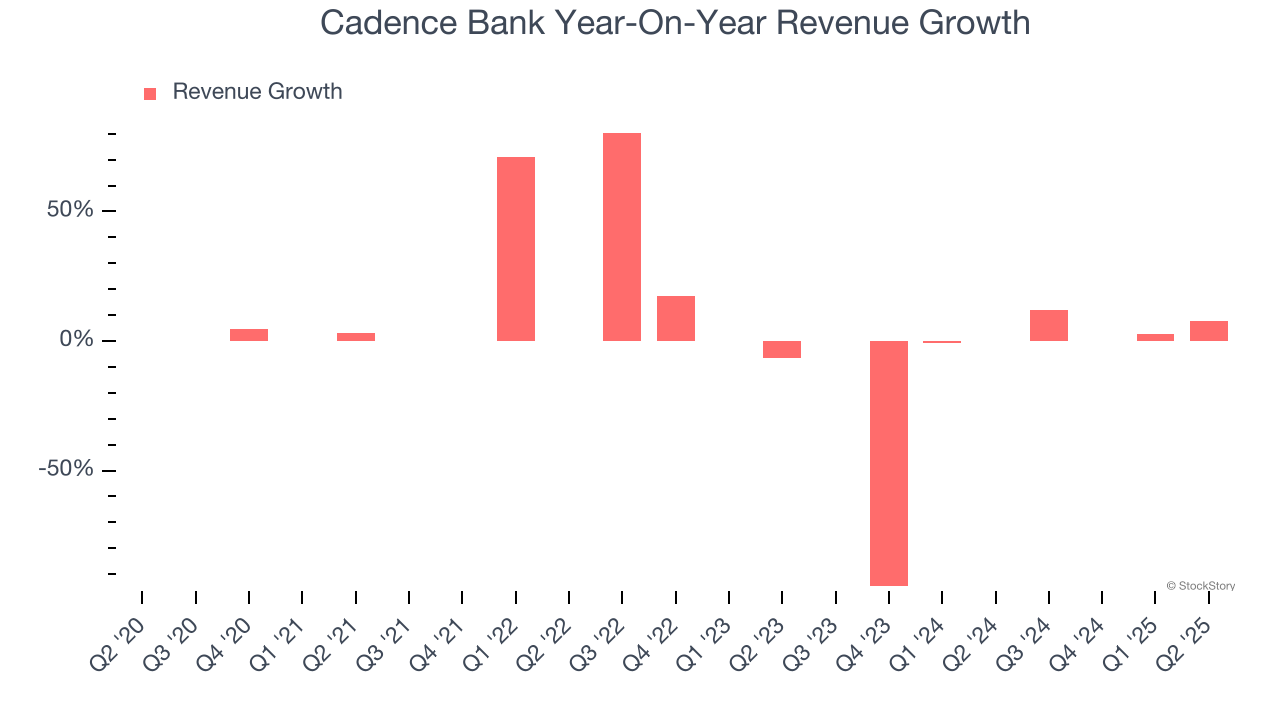 Note: Quarters not shown were determined to be outliers, impacted by outsized investment gains/losses that are not indicative of the recurring fundamentals of the business.
This quarter, Cadence Bank reported year-on-year revenue growth of 7.6%, and its $476.3 million of revenue exceeded Wall Street’s estimates by 1.7%.
Net interest income made up 75% of the company’s total revenue during the last five years, meaning lending operations are Cadence Bank’s largest source of revenue.
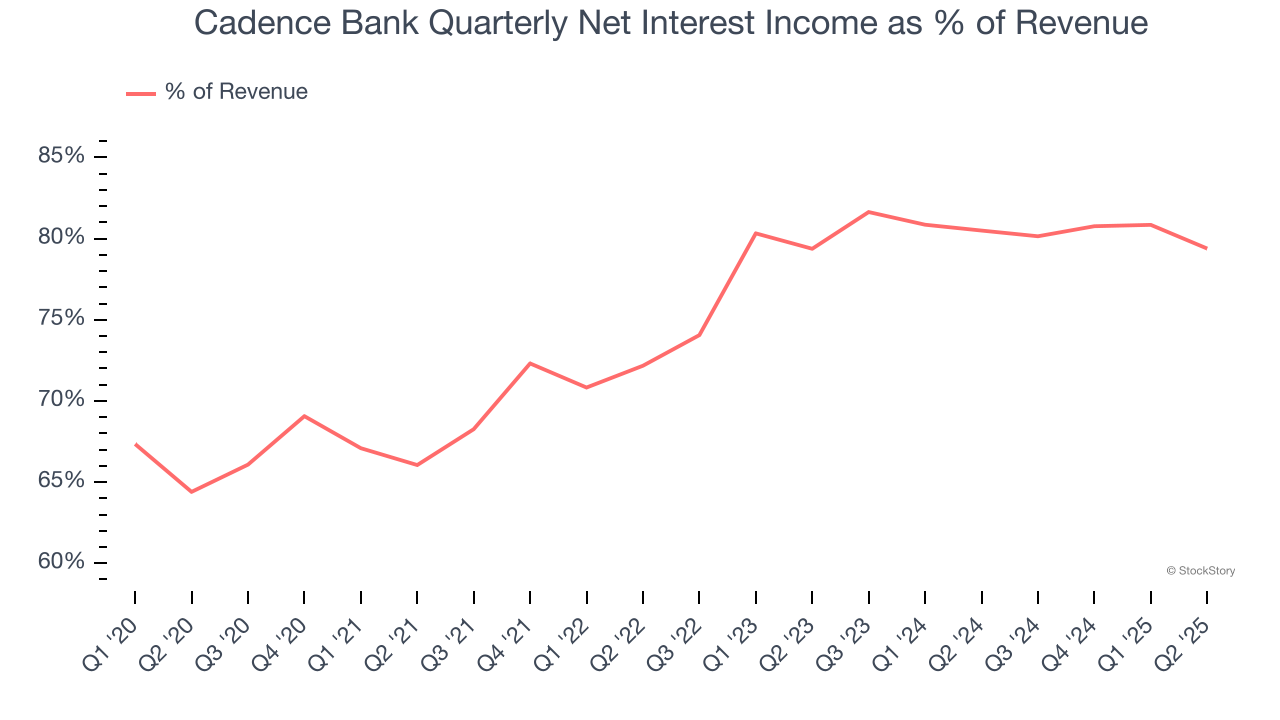
Our experience and research show the market cares primarily about a bank’s net interest income growth as non-interest income is considered a lower-quality and non-recurring revenue source.
Today’s young investors won’t have read the timeless lessons in Gorilla Game: Picking Winners In High Technology because it was written more than 20 years ago when Microsoft and Apple were first establishing their supremacy. But if we apply the same principles, then enterprise software stocks leveraging their own generative AI capabilities may well be the Gorillas of the future. So, in that spirit, we are excited to present our Special Free Report on a profitable, fast-growing enterprise software stock that is already riding the automation wave and looking to catch the generative AI next.
Tangible Book Value Per Share (TBVPS)
Banks are balance sheet-driven businesses because they generate earnings primarily through borrowing and lending. They’re also valued based on their balance sheet strength and ability to compound book value (another name for shareholders’ equity) over time.
Because of this, tangible book value per share (TBVPS) emerges as the critical performance benchmark. By excluding intangible assets with uncertain liquidation values, this metric captures real, liquid net worth per share. On the other hand, EPS is often distorted by mergers and flexible loan loss accounting. TBVPS provides clearer performance insights.
Cadence Bank’s TBVPS grew at an impressive 7.2% annual clip over the last five years. TBVPS growth has also accelerated recently, growing by 23.6% annually over the last two years from $15.01 to $22.94 per share.
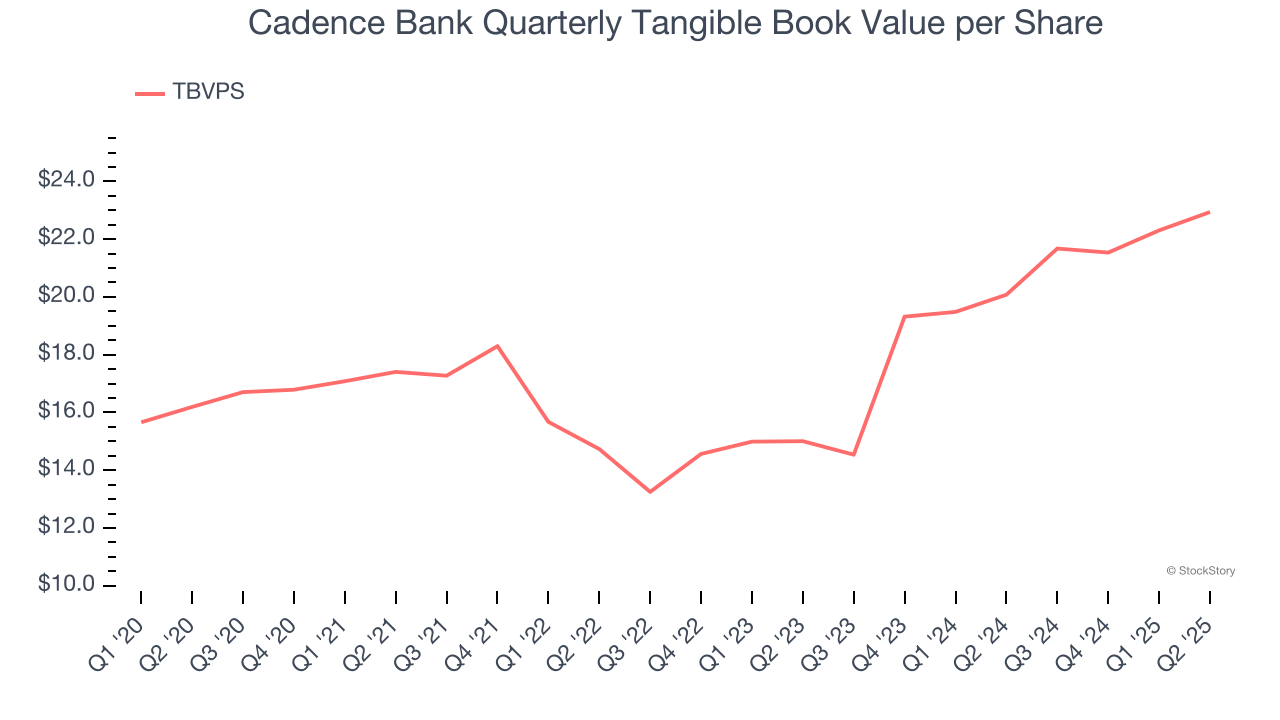
Over the next 12 months, Consensus estimates call for Cadence Bank’s TBVPS to grow by 1.5% to $23.29, lousy growth rate.
Key Takeaways from Cadence Bank’s Q2 Results
It was encouraging to see Cadence Bank beat analysts’ revenue, tangible book value per share, and EPS estimates. Overall, this print had some key positives. The market seemed to be hoping for more, and the stock traded down 1.4% to $35.45 immediately following the results.
Is Cadence Bank an attractive investment opportunity at the current price? What happened in the latest quarter matters, but not as much as longer-term business quality and valuation, when deciding whether to invest in this stock. We cover that in our actionable full research report which you can read here, it’s free.


