
Midwest regional bank QCR Holdings (NASDAQGM:QCRH) missed Wall Street’s revenue expectations in Q2 CY2025, with sales falling 10.2% year on year to $84.2 million. Its non-GAAP profit of $1.73 per share was 8.8% above analysts’ consensus estimates.
Is now the time to buy QCR Holdings? Find out by accessing our full research report, it’s free.
QCR Holdings (QCRH) Q2 CY2025 Highlights:
- Net Interest Income: $62.08 million vs analyst estimates of $62.28 million (10.5% year-on-year growth, in line)
- Net Interest Margin: 3% vs analyst estimates of 3.5% (30 basis point year-on-year decrease, 48 bps miss)
- Revenue: $84.2 million vs analyst estimates of $85.19 million (10.2% year-on-year decline, 1.2% miss)
- Efficiency Ratio: 58.9% vs analyst estimates of 56.7% (2.2 percentage point miss)
- Adjusted EPS: $1.73 vs analyst estimates of $1.59 (8.8% beat)
- Market Capitalization: $1.28 billion
“We delivered strong second quarter results highlighted by a significant increase in net interest income from the previous quarter, driven by both net interest margin expansion and strong loan growth, as well as improved capital markets revenue, and disciplined noninterest expense management,” said Todd Gipple, President and Chief Executive Officer.
Company Overview
With roots dating back to 1993 and a name reflecting its original Quad Cities market, QCR Holdings (NASDAQGM:QCRH) operates four community banks across Iowa and Missouri, providing commercial, consumer banking, and trust services to businesses and individuals.
Sales Growth
In general, banks make money from two primary sources. The first is net interest income, which is interest earned on loans, mortgages, and investments in securities minus interest paid out on deposits. The second source is non-interest income, which can come from bank account, credit card, wealth management, investing banking, and trading fees.
Over the last five years, QCR Holdings grew its revenue at a decent 6.9% compounded annual growth rate. Its growth was slightly above the average bank company and shows its offerings resonate with customers.
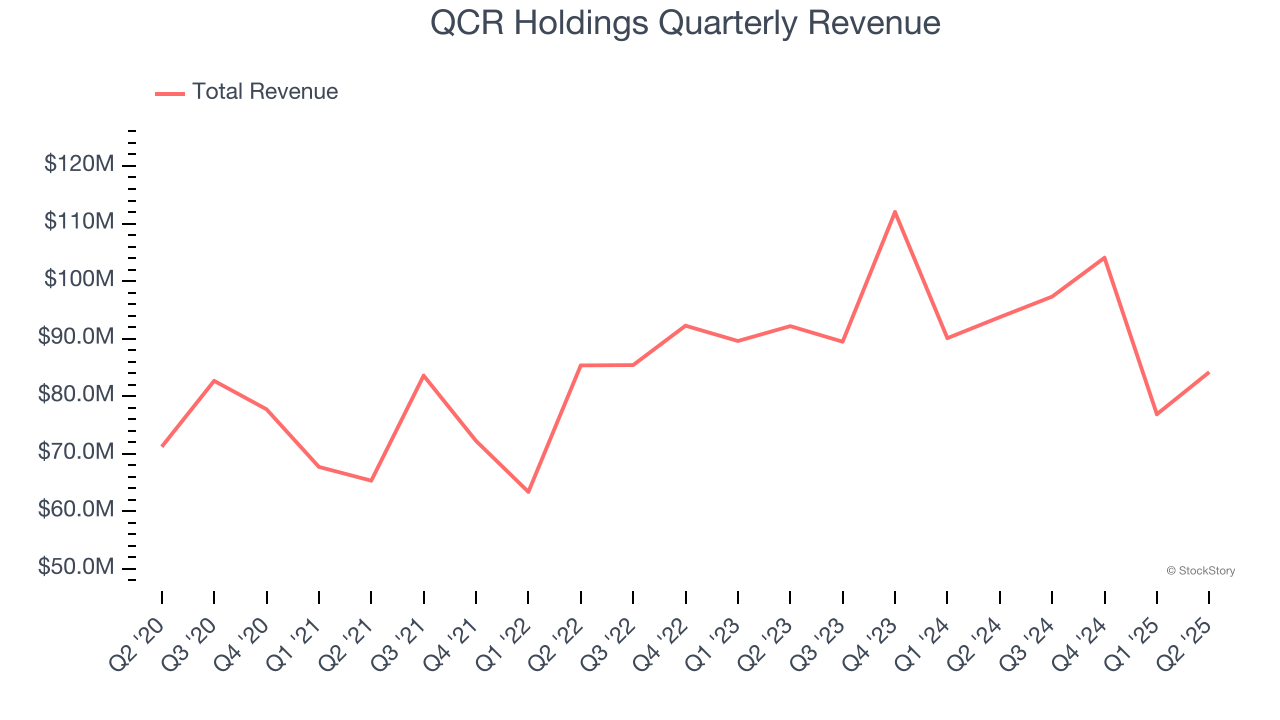
We at StockStory place the most emphasis on long-term growth, but within financials, a half-decade historical view may miss recent interest rate changes, market returns, and industry trends. QCR Holdings’s recent performance shows its demand has slowed as its revenue was flat over the last two years. 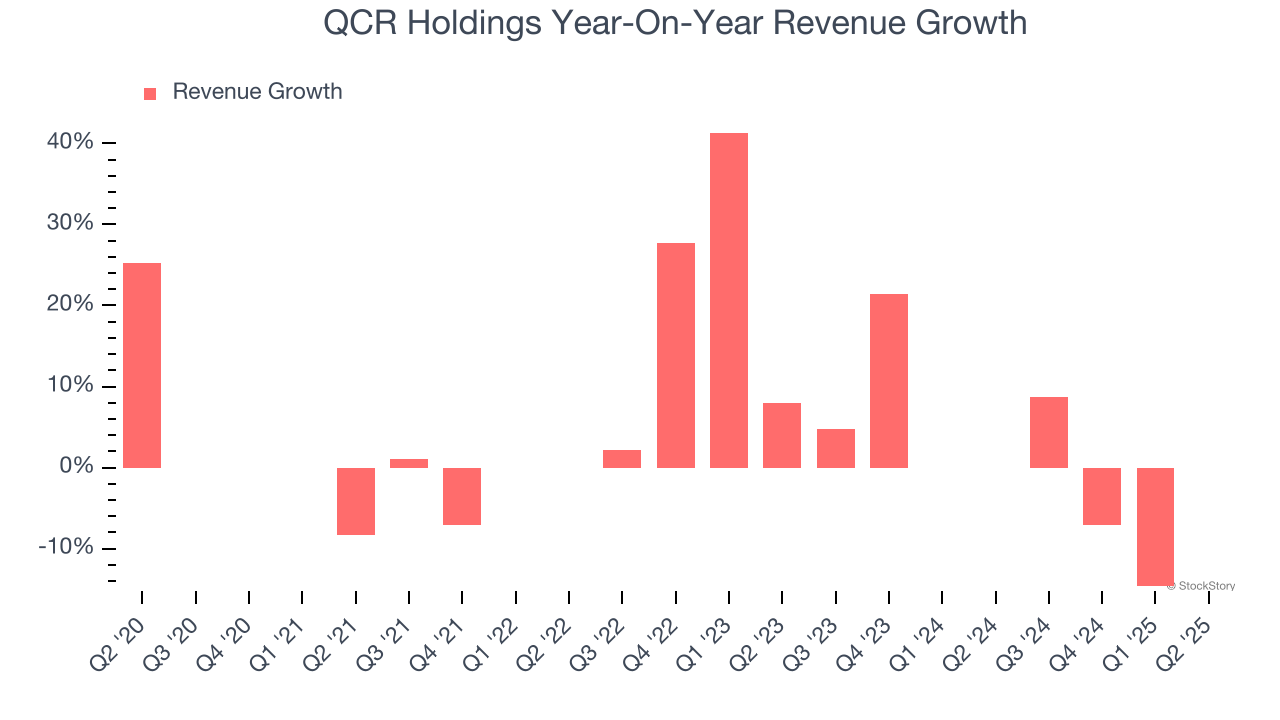 Note: Quarters not shown were determined to be outliers, impacted by outsized investment gains/losses that are not indicative of the recurring fundamentals of the business.
This quarter, QCR Holdings missed Wall Street’s estimates and reported a rather uninspiring 10.2% year-on-year revenue decline, generating $84.2 million of revenue.
Net interest income made up 63.4% of the company’s total revenue during the last five years, meaning lending operations are QCR Holdings’s largest source of revenue.
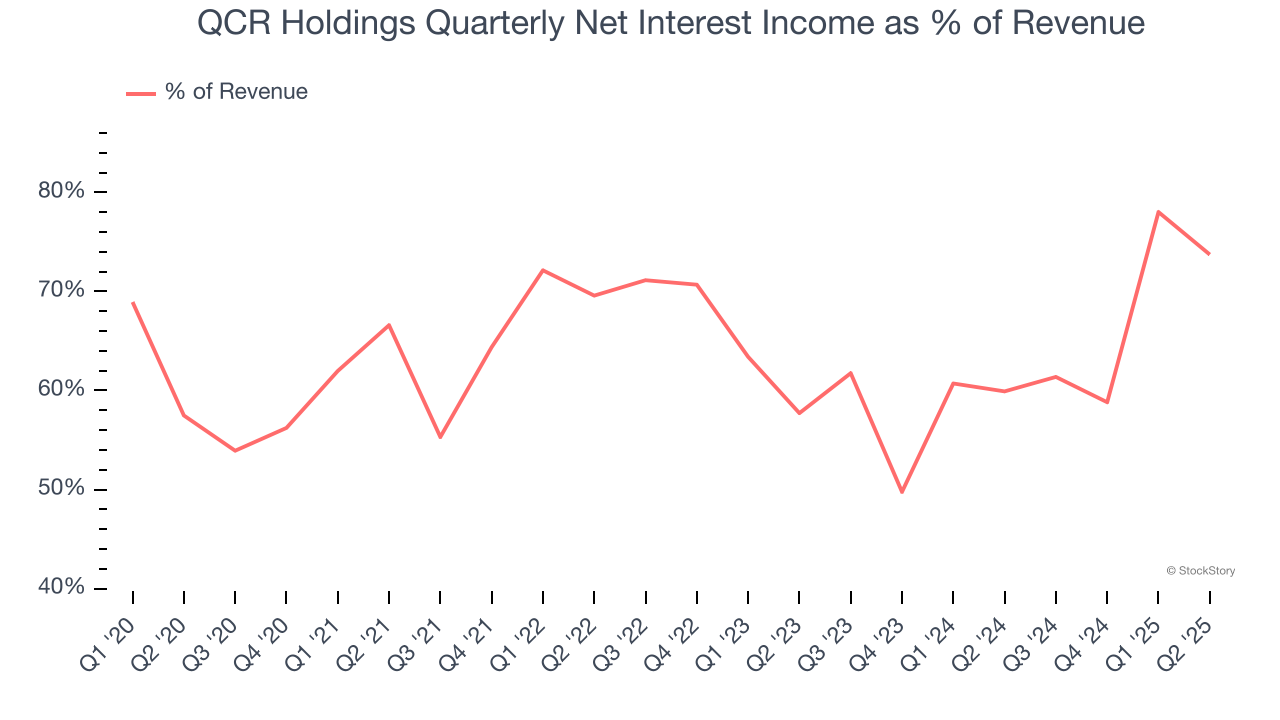
Our experience and research show the market cares primarily about a bank’s net interest income growth as non-interest income is considered a lower-quality and non-recurring revenue source.
Software is eating the world and there is virtually no industry left that has been untouched by it. That drives increasing demand for tools helping software developers do their jobs, whether it be monitoring critical cloud infrastructure, integrating audio and video functionality, or ensuring smooth content streaming. Click here to access a free report on our 3 favorite stocks to play this generational megatrend.
Tangible Book Value Per Share (TBVPS)
Banks are balance sheet-driven businesses because they generate earnings primarily through borrowing and lending. They’re also valued based on their balance sheet strength and ability to compound book value (another name for shareholders’ equity) over time.
Because of this, tangible book value per share (TBVPS) emerges as the critical performance benchmark. By excluding intangible assets with uncertain liquidation values, this metric captures real, liquid net worth per share. On the other hand, EPS is often distorted by mergers and flexible loan loss accounting. TBVPS provides clearer performance insights.
QCR Holdings’s TBVPS grew at an incredible 12.5% annual clip over the last five years. TBVPS growth has also accelerated recently, growing by 15.4% annually over the last two years from $39.99 to $53.28 per share.
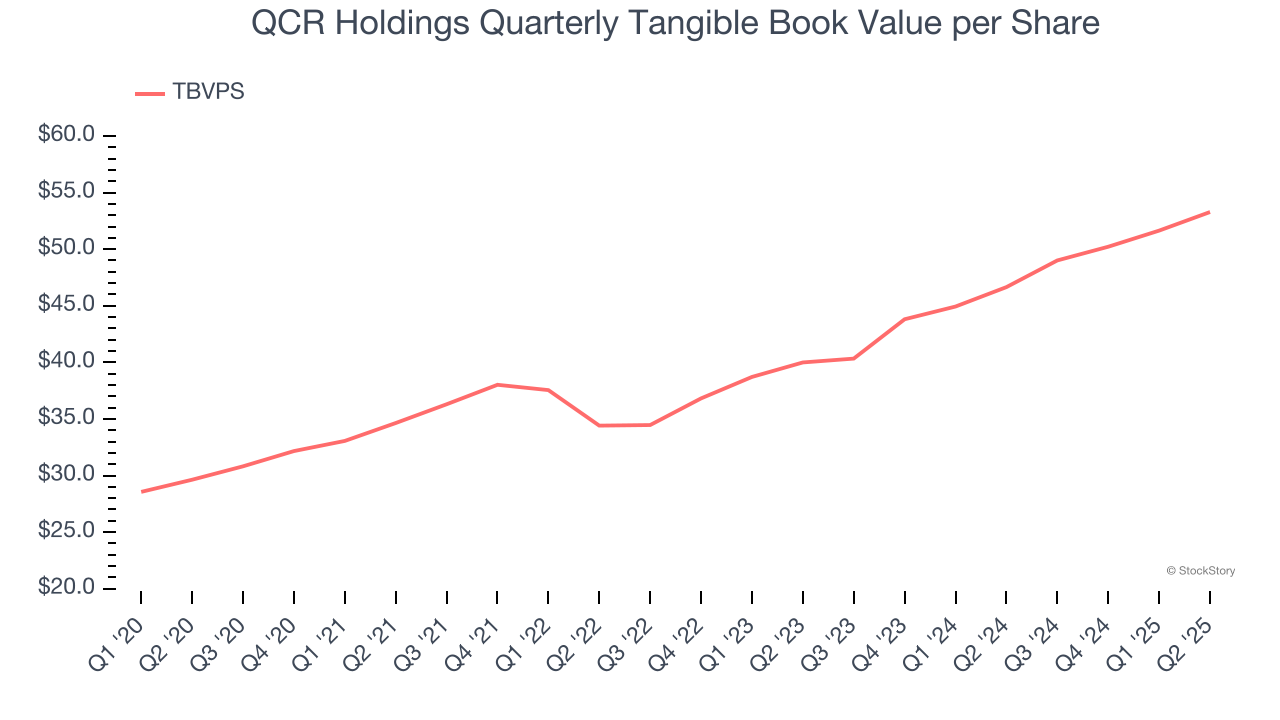
Over the next 12 months, Consensus estimates call for QCR Holdings’s TBVPS to grow by 13.6% to $60.51, top-notch growth rate.
Key Takeaways from QCR Holdings’s Q2 Results
It was encouraging to see QCR Holdings beat analysts’ EPS expectations this quarter. On the other hand, its revenue slightly missed and its net interest income was in line with Wall Street’s estimates. Overall, this was a weaker quarter. The stock remained flat at $75.25 immediately after reporting.
Is QCR Holdings an attractive investment opportunity right now? When making that decision, it’s important to consider its valuation, business qualities, as well as what has happened in the latest quarter. We cover that in our actionable full research report which you can read here, it’s free.


