Hospitality company Travel + Leisure (NYSE: TNL) beat Wall Street’s revenue expectations in Q2 CY2025, with sales up 3.4% year on year to $1.02 billion. Its non-GAAP profit of $1.65 per share was in line with analysts’ consensus estimates.
Is now the time to buy Travel + Leisure? Find out by accessing our full research report, it’s free.
Travel + Leisure (TNL) Q2 CY2025 Highlights:
- Revenue: $1.02 billion vs analyst estimates of $1.01 billion (3.4% year-on-year growth, 0.7% beat)
- Adjusted EPS: $1.65 vs analyst estimates of $1.66 (in line)
- Adjusted EBITDA: $250 million vs analyst estimates of $249.7 million (24.6% margin, in line)
- EBITDA guidance for the full year is $970 million at the midpoint, in line with analyst expectations
- Operating Margin: 20.2%, up from 19.2% in the same quarter last year
- Free Cash Flow Margin: 2.3%, down from 15.5% in the same quarter last year
- Tours Conducted: 197,000, up 5,000 year on year
- Market Capitalization: $3.84 billion
Company Overview
Formerly known as Wyndham Destinations, Travel + Leisure (NYSE: TNL) is a global vacation company that provides travelers with vacation ownership, exchange, and travel services.
Revenue Growth
A company’s long-term performance is an indicator of its overall quality. Any business can experience short-term success, but top-performing ones enjoy sustained growth for years. Unfortunately, Travel + Leisure’s 5.6% annualized revenue growth over the last five years was sluggish. This was below our standard for the consumer discretionary sector and is a rough starting point for our analysis.
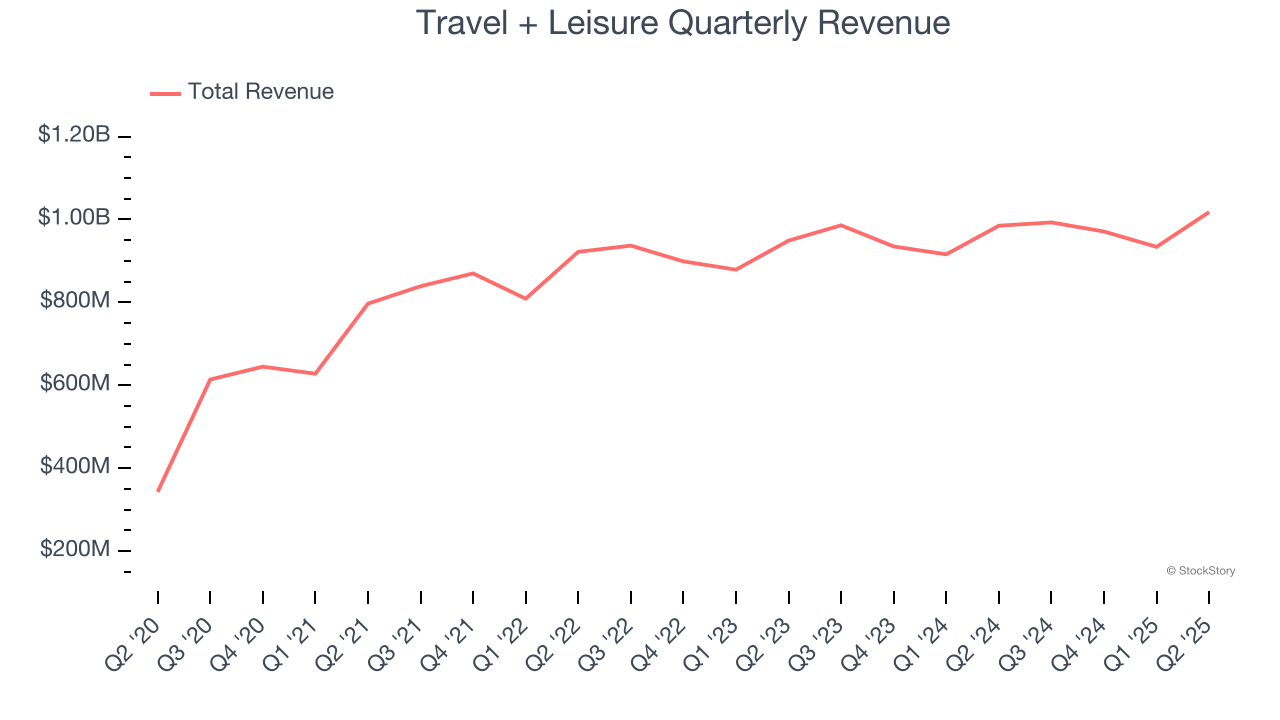
We at StockStory place the most emphasis on long-term growth, but within consumer discretionary, a stretched historical view may miss a company riding a successful new property or trend. Travel + Leisure’s recent performance shows its demand has slowed as its annualized revenue growth of 3.4% over the last two years was below its five-year trend. 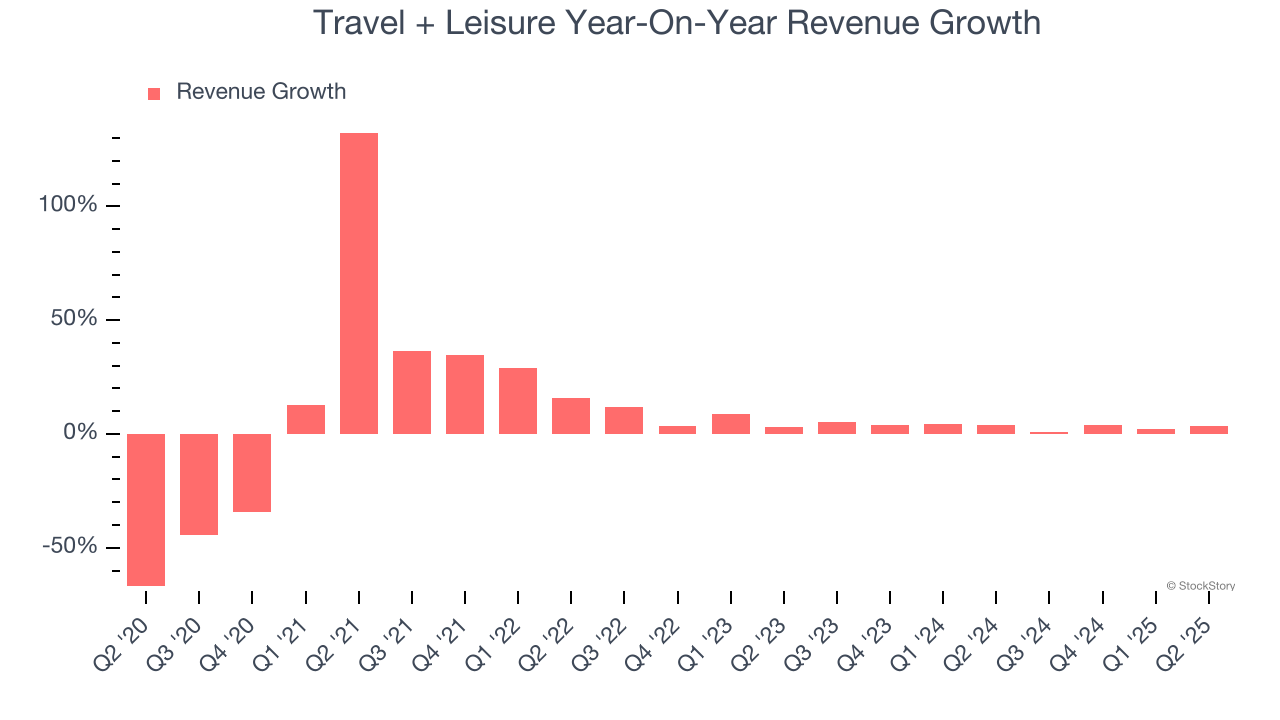
We can better understand the company’s revenue dynamics by analyzing its number of tours conducted, which reached 197,000 in the latest quarter. Over the last two years, Travel + Leisure’s tours conducted averaged 8.8% year-on-year growth. Because this number is higher than its revenue growth during the same period, we can see the company’s monetization has fallen. 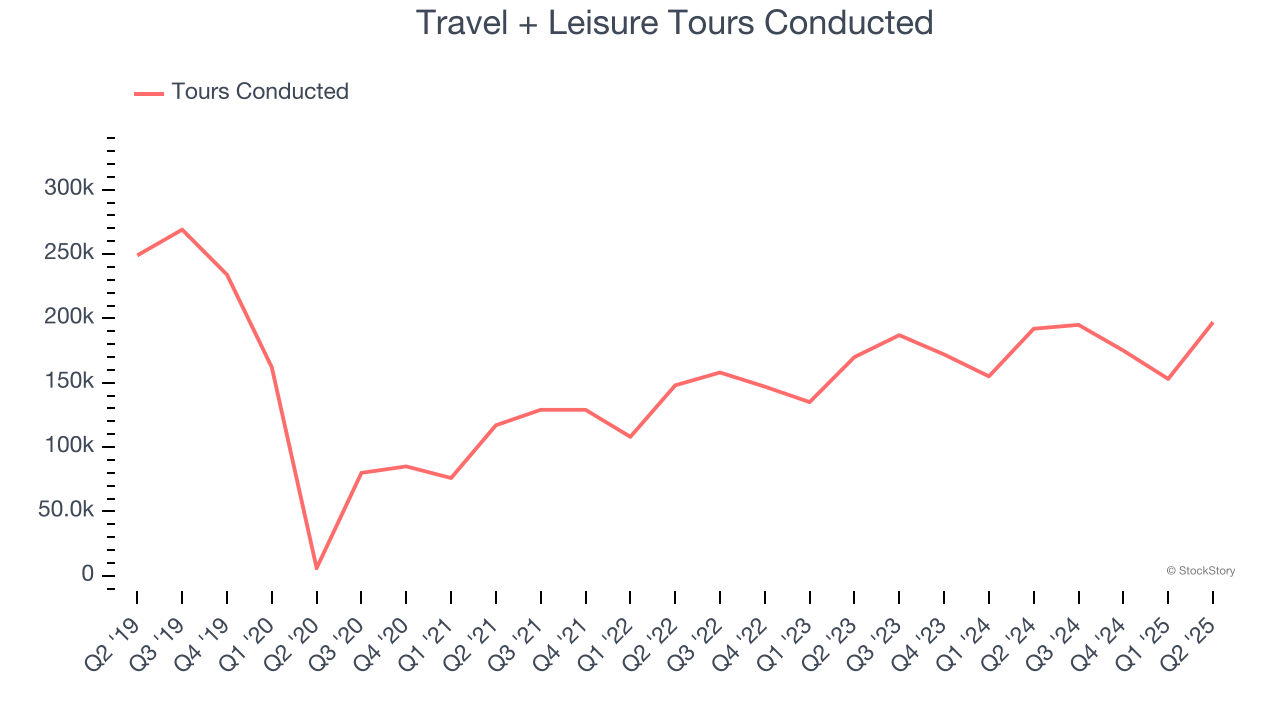
This quarter, Travel + Leisure reported modest year-on-year revenue growth of 3.4% but beat Wall Street’s estimates by 0.7%.
Looking ahead, sell-side analysts expect revenue to grow 3.2% over the next 12 months, similar to its two-year rate. This projection is underwhelming and indicates its newer products and services will not lead to better top-line performance yet.
Software is eating the world and there is virtually no industry left that has been untouched by it. That drives increasing demand for tools helping software developers do their jobs, whether it be monitoring critical cloud infrastructure, integrating audio and video functionality, or ensuring smooth content streaming. Click here to access a free report on our 3 favorite stocks to play this generational megatrend.
Operating Margin
Travel + Leisure’s operating margin might fluctuated slightly over the last 12 months but has generally stayed the same, averaging 19.3% over the last two years. This profitability was top-notch for a consumer discretionary business, showing it’s an well-run company with an efficient cost structure.
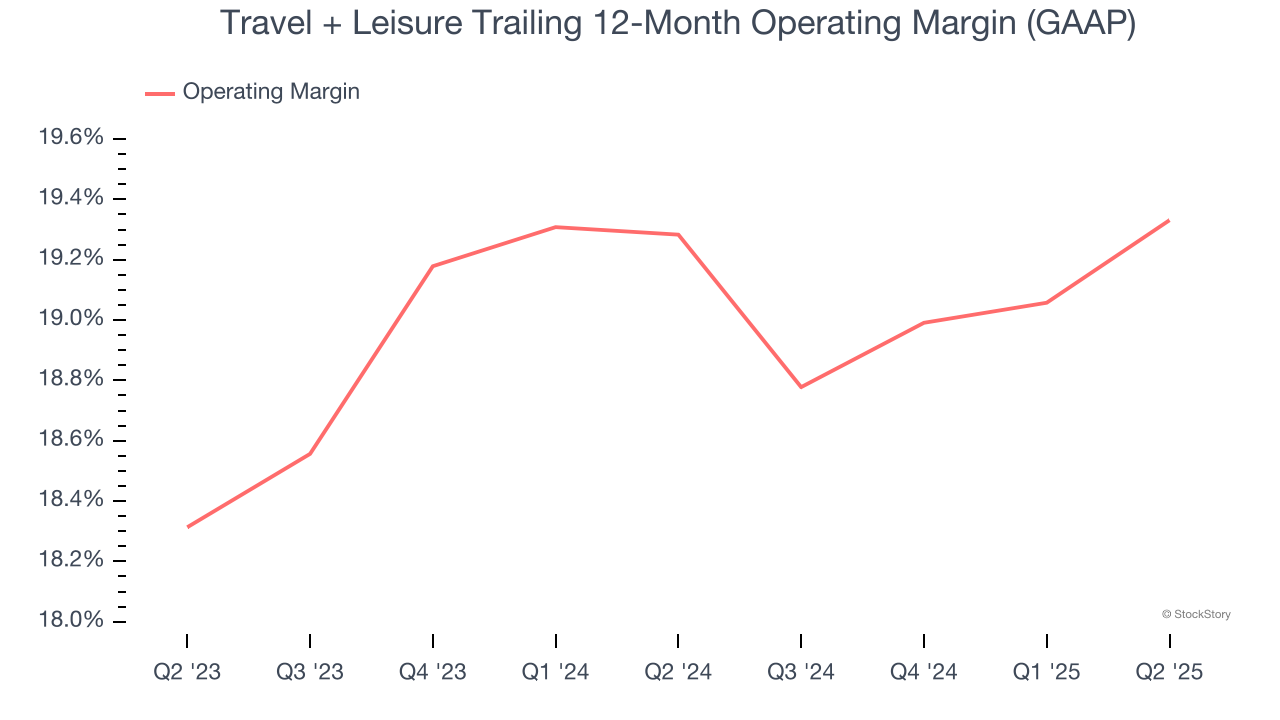
This quarter, Travel + Leisure generated an operating margin profit margin of 20.2%, up 1 percentage points year on year. This increase was a welcome development and shows it was more efficient.
Earnings Per Share
Revenue trends explain a company’s historical growth, but the long-term change in earnings per share (EPS) points to the profitability of that growth – for example, a company could inflate its sales through excessive spending on advertising and promotions.
Travel + Leisure’s EPS grew at an astounding 41.7% compounded annual growth rate over the last five years, higher than its 5.6% annualized revenue growth. This tells us the company became more profitable on a per-share basis as it expanded.
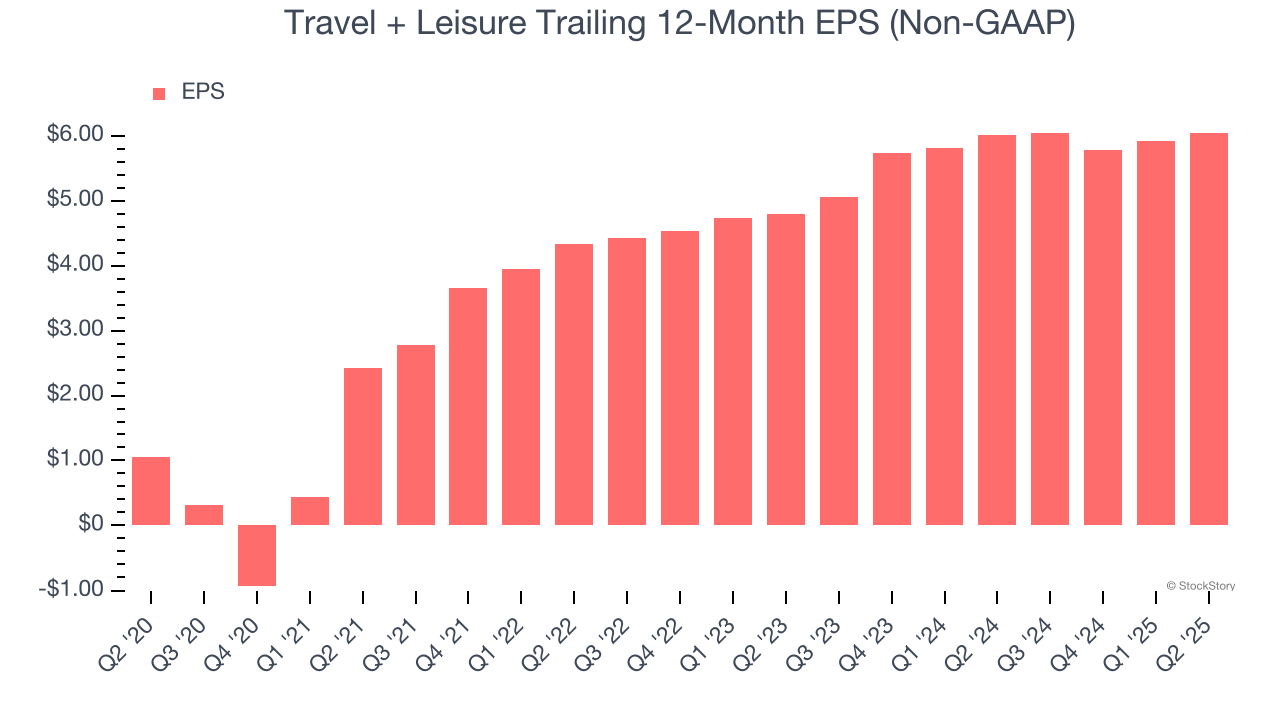
In Q2, Travel + Leisure reported EPS at $1.65, up from $1.52 in the same quarter last year. This print was close to analysts’ estimates. Over the next 12 months, Wall Street expects Travel + Leisure’s full-year EPS of $6.05 to grow 10.6%.
Key Takeaways from Travel + Leisure’s Q2 Results
It was good to see Travel + Leisure's revenue slightly beat analysts’ expectations. Zooming out, we think this was a decent quarter. The stock remained flat at $57.49 immediately following the results.
So do we think Travel + Leisure is an attractive buy at the current price? We think that the latest quarter is only one piece of the longer-term business quality puzzle. Quality, when combined with valuation, can help determine if the stock is a buy. We cover that in our actionable full research report which you can read here, it’s free.