Beer company Boston Beer (NYSE: SAM) met Wall Street’s revenue expectations in Q2 CY2025, with sales up 1.5% year on year to $587.9 million. Its GAAP profit of $5.45 per share was 36.4% above analysts’ consensus estimates.
Is now the time to buy Boston Beer? Find out by accessing our full research report, it’s free.
Boston Beer (SAM) Q2 CY2025 Highlights:
- Revenue: $587.9 million vs analyst estimates of $589.4 million (1.5% year-on-year growth, in line)
- EPS (GAAP): $5.45 vs analyst estimates of $4.00 (36.4% beat)
- Adjusted EBITDA: $98.56 million vs analyst estimates of $87.27 million (16.8% margin, 12.9% beat)
- EPS (GAAP) guidance for the full year is $8.13 at the midpoint, missing analyst estimates by 11.5%
- Operating Margin: 14%, up from 12.2% in the same quarter last year
- Free Cash Flow Margin: 19.1%, up from 13.1% in the same quarter last year
- Market Capitalization: $2.27 billion
“We are encouraged by our strong gross margin and earnings performance in the first half of 2025 and the positive consumer response to our Sun Cruiser innovation,” said President and CEO Michael Spillane.
Company Overview
Known for its flavorful beverages challenging the status quo, Boston Beer (NYSE: SAM) is a pioneer in craft brewing and a symbol of American innovation in the alcoholic beverage industry.
Revenue Growth
A company’s long-term performance is an indicator of its overall quality. Even a bad business can shine for one or two quarters, but a top-tier one grows for years.
With $2.05 billion in revenue over the past 12 months, Boston Beer is a small consumer staples company, which sometimes brings disadvantages compared to larger competitors benefiting from economies of scale and negotiating leverage with retailers.
As you can see below, Boston Beer’s sales grew at a sluggish 1.6% compounded annual growth rate over the last three years. This shows it failed to generate demand in any major way and is a rough starting point for our analysis.
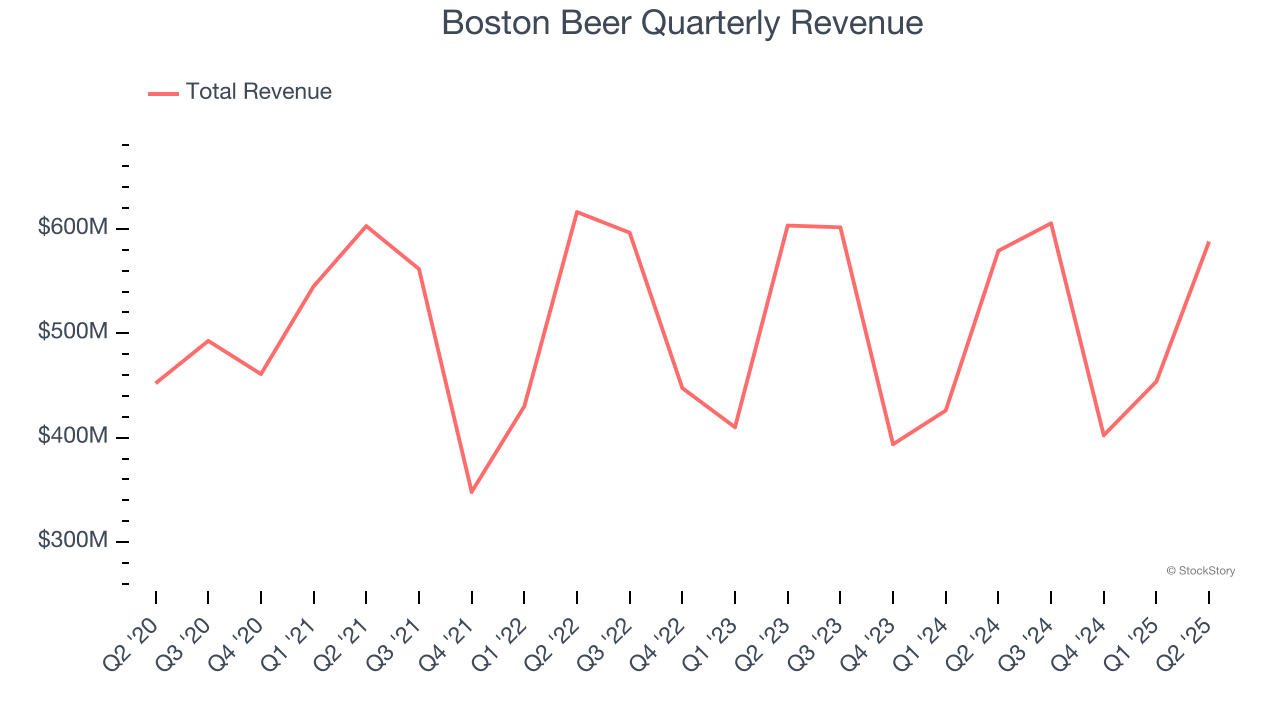
This quarter, Boston Beer grew its revenue by 1.5% year on year, and its $587.9 million of revenue was in line with Wall Street’s estimates.
Looking ahead, sell-side analysts expect revenue to remain flat over the next 12 months, a slight deceleration versus the last three years. This projection is underwhelming and indicates its products will see some demand headwinds.
Unless you’ve been living under a rock, it should be obvious by now that generative AI is going to have a huge impact on how large corporations do business. While Nvidia and AMD are trading close to all-time highs, we prefer a lesser-known (but still profitable) stock benefiting from the rise of AI. Click here to access our free report one of our favorites growth stories.
Cash Is King
If you’ve followed StockStory for a while, you know we emphasize free cash flow. Why, you ask? We believe that in the end, cash is king, and you can’t use accounting profits to pay the bills.
Boston Beer has shown robust cash profitability, driven by its attractive business model that enables it to reinvest or return capital to investors. The company’s free cash flow margin averaged 10.2% over the last two years, quite impressive for a consumer staples business. The divergence from its underwhelming operating margin stems from the add-back of non-cash charges like depreciation and stock-based compensation. GAAP operating profit expenses these line items, but free cash flow does not.
Taking a step back, we can see that Boston Beer’s margin expanded by 1.3 percentage points over the last year. This shows the company is heading in the right direction, and we can see it became a less capital-intensive business because its free cash flow profitability rose while its operating profitability was flat.
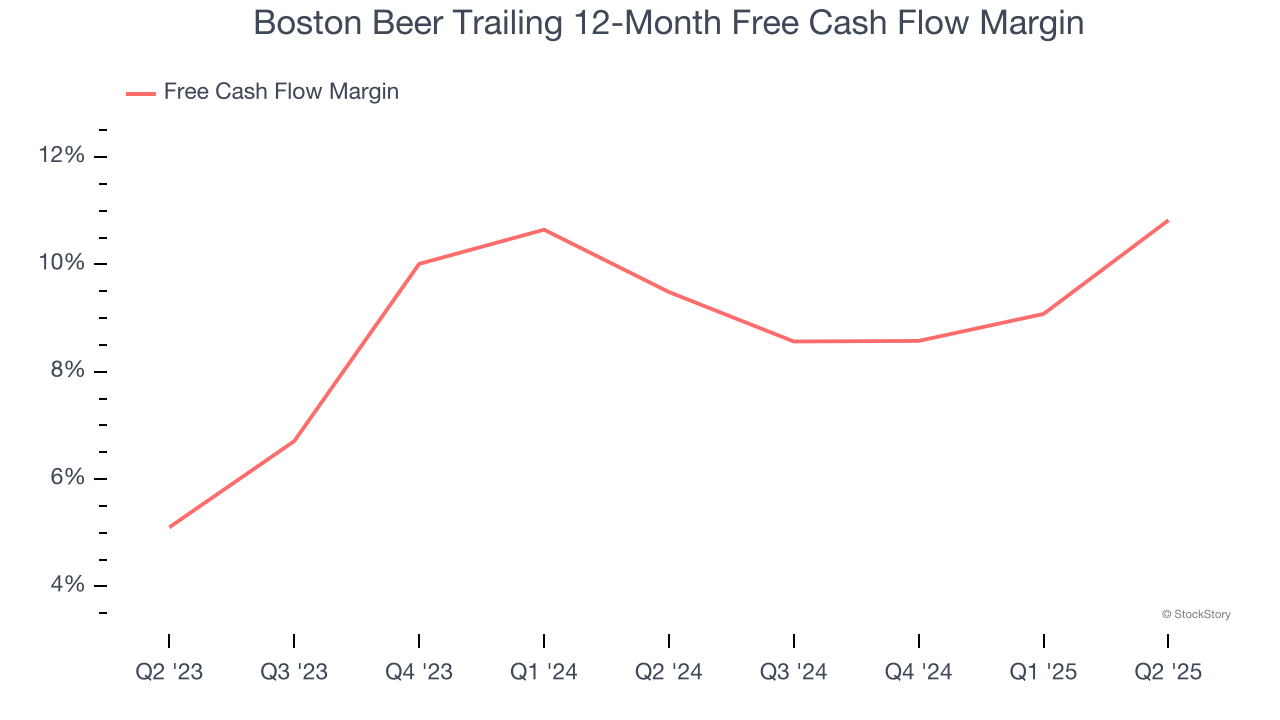
Boston Beer’s free cash flow clocked in at $112.2 million in Q2, equivalent to a 19.1% margin. This result was good as its margin was 6 percentage points higher than in the same quarter last year, building on its favorable historical trend.
Key Takeaways from Boston Beer’s Q2 Results
Although revenue was in line with expectations, we were impressed by how significantly Boston Beer blew past analysts’ EBITDA expectations this quarter due to better profitability. We were also glad its EPS outperformed Wall Street’s estimates. Operating and free cash flow margin were up noticeably from the same period last year. On the other hand, its full-year EPS guidance missed. Overall, this print had some key positives. The stock traded up 8% to $218 immediately after reporting.
Is Boston Beer an attractive investment opportunity right now? If you’re making that decision, you should consider the bigger picture of valuation, business qualities, as well as the latest earnings. We cover that in our actionable full research report which you can read here, it’s free.