
Satellite communications provider reported Q2 CY2025 results topping the market’s revenue expectations, with sales up 7.9% year on year to $216.9 million. Its GAAP profit of $0.20 per share was 16.9% below analysts’ consensus estimates.
Is now the time to buy Iridium? Find out by accessing our full research report, it’s free.
Iridium (IRDM) Q2 CY2025 Highlights:
- Revenue: $216.9 million vs analyst estimates of $213.4 million (7.9% year-on-year growth, 1.6% beat)
- EPS (GAAP): $0.20 vs analyst expectations of $0.24 (16.9% miss)
- Adjusted EBITDA: $121.3 million vs analyst estimates of $122.2 million (55.9% margin, 0.7% miss)
- EBITDA guidance for the full year is $495 million at the midpoint, in line with analyst expectations
- Operating Margin: 23.2%, up from 21.7% in the same quarter last year
- Subscribers: 1.92 million
- Market Capitalization: $3.51 billion
"We're making great progress on our direct-to-device service with testing now underway and are also finding exciting, innovative applications for our new PNT service," said Matt Desch, CEO, Iridium.
Company Overview
With a constellation of 66 low-earth orbit satellites providing coverage to every inch of the planet, Iridium Communications (NASDAQ: IRDM) operates a global satellite network that provides voice and data services to customers in remote areas where traditional telecommunications are unavailable.
Revenue Growth
A company’s long-term sales performance can indicate its overall quality. Any business can experience short-term success, but top-performing ones enjoy sustained growth for years.
With $857.5 million in revenue over the past 12 months, Iridium is a small player in the business services space, which sometimes brings disadvantages compared to larger competitors benefiting from economies of scale and numerous distribution channels. On the bright side, it can grow faster because it has more room to expand.
As you can see below, Iridium grew its sales at a solid 8.5% compounded annual growth rate over the last five years. This shows it had high demand, a useful starting point for our analysis.
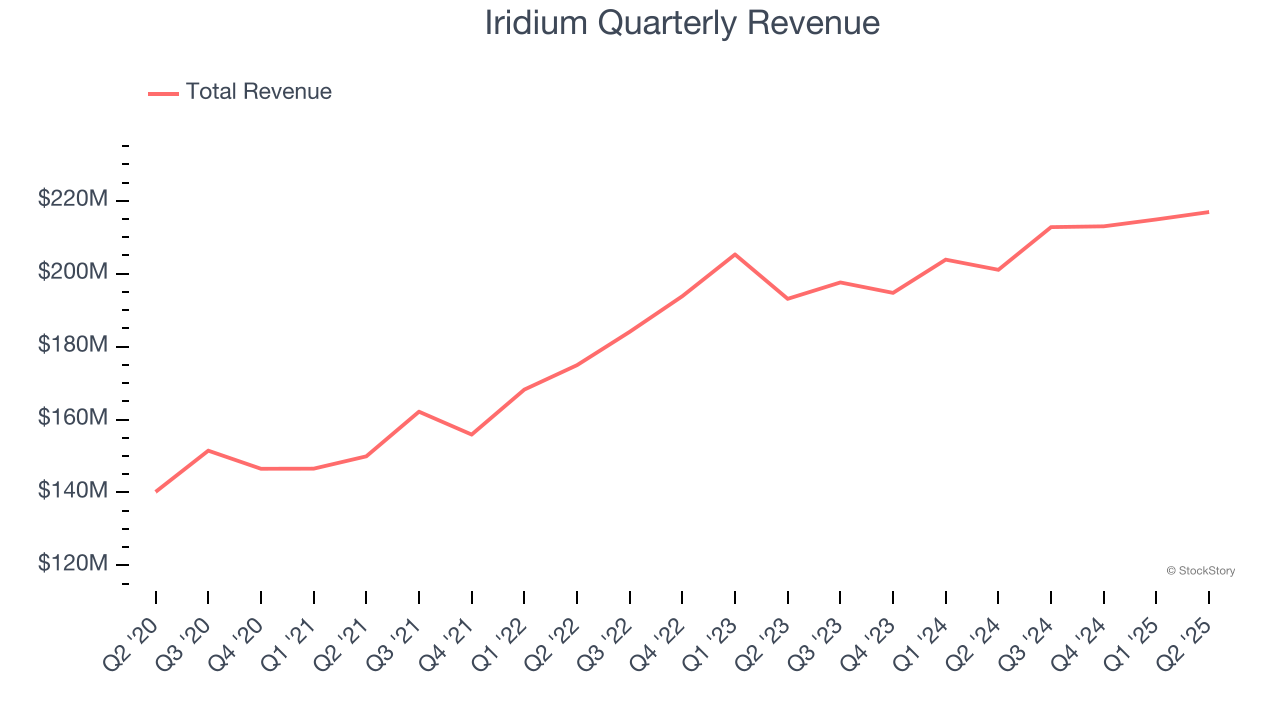
We at StockStory place the most emphasis on long-term growth, but within business services, a half-decade historical view may miss recent innovations or disruptive industry trends. Iridium’s annualized revenue growth of 5.1% over the last two years is below its five-year trend, but we still think the results were respectable. 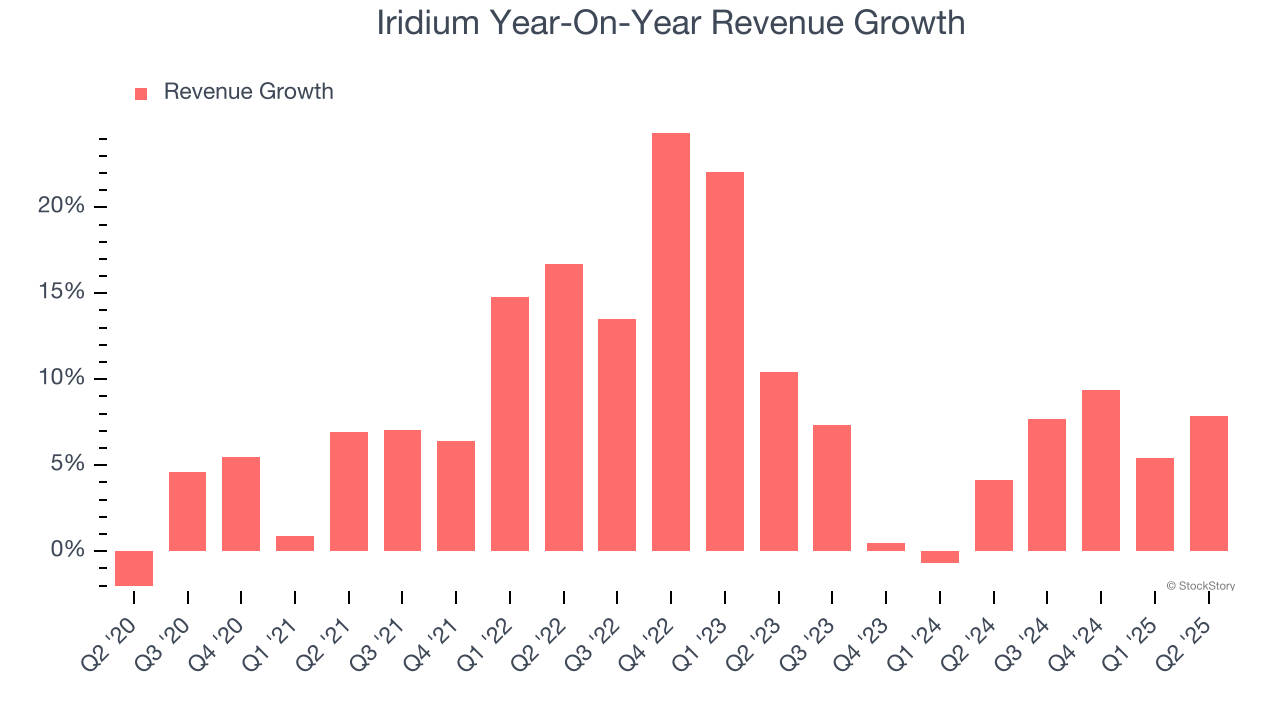
This quarter, Iridium reported year-on-year revenue growth of 7.9%, and its $216.9 million of revenue exceeded Wall Street’s estimates by 1.6%.
Looking ahead, sell-side analysts expect revenue to grow 3.5% over the next 12 months, a slight deceleration versus the last two years. This projection doesn't excite us and indicates its products and services will face some demand challenges.
Here at StockStory, we certainly understand the potential of thematic investing. Diverse winners from Microsoft (MSFT) to Alphabet (GOOG), Coca-Cola (KO) to Monster Beverage (MNST) could all have been identified as promising growth stories with a megatrend driving the growth. So, in that spirit, we’ve identified a relatively under-the-radar profitable growth stock benefiting from the rise of AI, available to you FREE via this link.
Operating Margin
Iridium has been an efficient company over the last five years. It was one of the more profitable businesses in the business services sector, boasting an average operating margin of 14.5%.
Analyzing the trend in its profitability, Iridium’s operating margin rose by 18.9 percentage points over the last five years, as its sales growth gave it immense operating leverage.
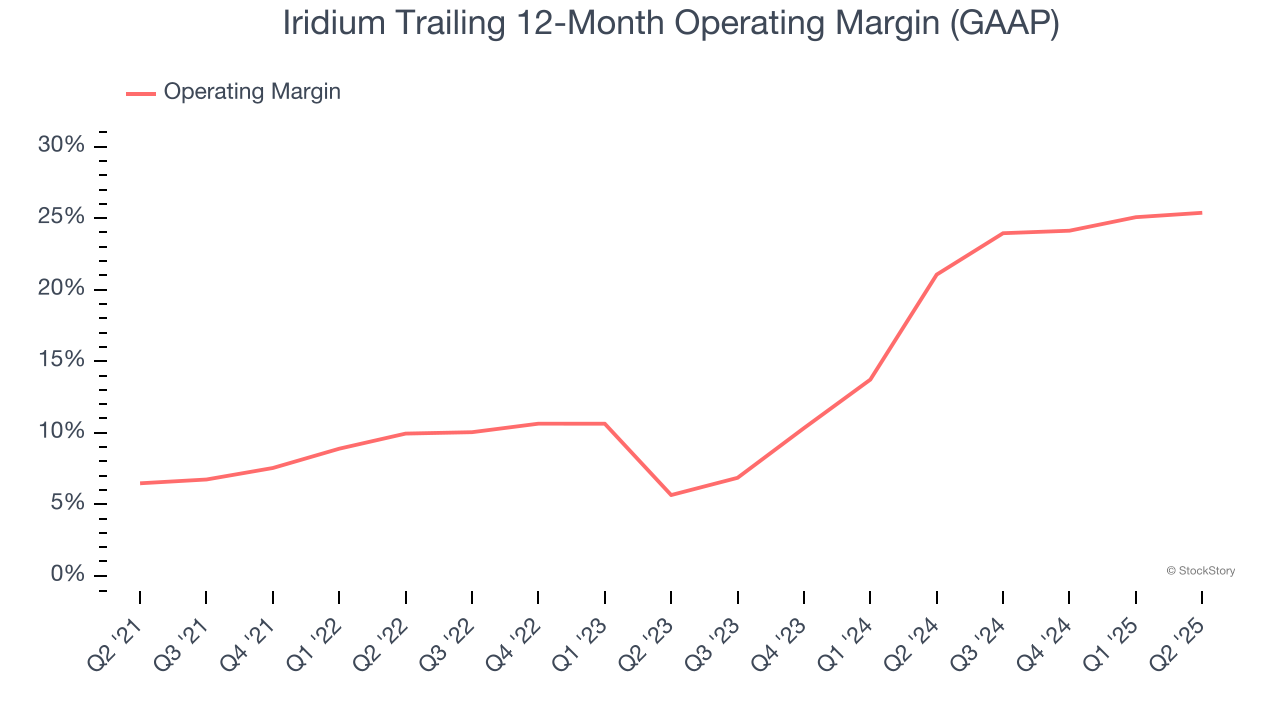
This quarter, Iridium generated an operating margin profit margin of 23.2%, up 1.5 percentage points year on year. This increase was a welcome development and shows it was more efficient.
Earnings Per Share
We track the long-term change in earnings per share (EPS) for the same reason as long-term revenue growth. Compared to revenue, however, EPS highlights whether a company’s growth is profitable.
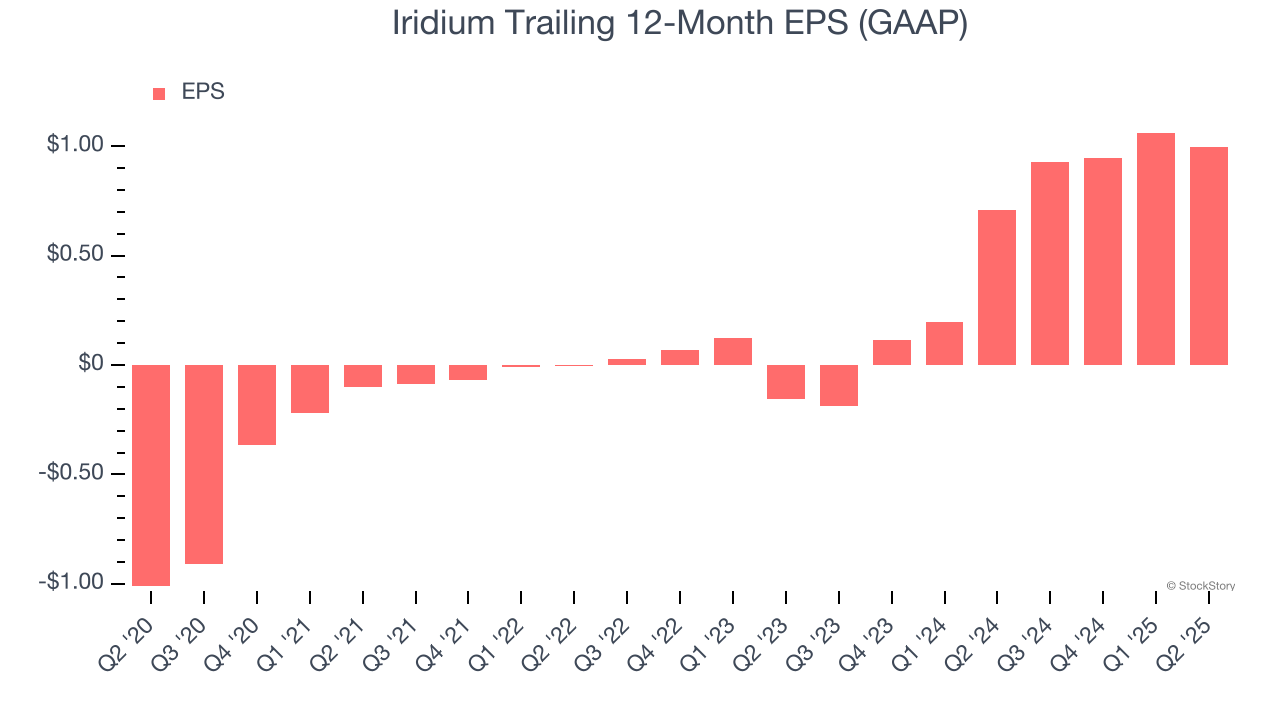
Iridium’s full-year EPS flipped from negative to positive over the last five years. This is encouraging and shows it’s at a critical moment in its life.
Like with revenue, we analyze EPS over a shorter period to see if we are missing a change in the business.
For Iridium, its two-year annual EPS growth of 189% was higher than its five-year trend. We love it when earnings growth accelerates, especially when it accelerates off an already high base.
In Q2, Iridium reported EPS at $0.20, down from $0.27 in the same quarter last year. This print missed analysts’ estimates, but we care more about long-term EPS growth than short-term movements. Over the next 12 months, Wall Street expects Iridium’s full-year EPS of $1.00 to grow 13.4%.
Key Takeaways from Iridium’s Q2 Results
It was encouraging to see Iridium beat analysts’ revenue expectations this quarter. On the other hand, its EPS missed. Overall, this was a softer quarter. The stock traded down 5.4% to $30.70 immediately after reporting.
Iridium’s latest earnings report disappointed. One quarter doesn’t define a company’s quality, so let’s explore whether the stock is a buy at the current price. If you’re making that decision, you should consider the bigger picture of valuation, business qualities, as well as the latest earnings. We cover that in our actionable full research report which you can read here, it’s free.