
Regional bank OceanFirst Financial (NASDAQ: OCFC) fell short of the market’s revenue expectations in Q2 CY2025, but sales rose 6.6% year on year to $99.37 million. Its GAAP profit of $0.28 per share was 16% below analysts’ consensus estimates.
Is now the time to buy OceanFirst Financial? Find out by accessing our full research report, it’s free.
OceanFirst Financial (OCFC) Q2 CY2025 Highlights:
- Net Interest Income: $87.64 million vs analyst estimates of $89.3 million (6.5% year-on-year growth, 1.9% miss)
- Net Interest Margin: 2.9% vs analyst estimates of 2.9% (20 basis point year-on-year increase, 2.2 bps miss)
- Revenue: $99.37 million vs analyst estimates of $100.7 million (6.6% year-on-year growth, 1.4% miss)
- Efficiency Ratio: 71.9% vs analyst estimates of 70.4% (1.6 percentage point miss)
- EPS (GAAP): $0.28 vs analyst expectations of $0.33 (16% miss)
- Market Capitalization: $1.06 billion
Chairman and Chief Executive Officer, Christopher D. Maher, commented on the Company’s results, “We are pleased to present our current quarter results, which reflected loan and deposit growth, stable asset quality metrics, capital returns through share repurchases, and modest net interest income and margin expansion.”
Company Overview
Tracing its roots back to 1902 when it began serving coastal New Jersey communities, OceanFirst Financial (NASDAQ: OCFC) operates as a regional bank holding company that provides commercial and consumer banking services primarily in New Jersey and surrounding metropolitan areas.
Sales Growth
Two primary revenue streams drive bank earnings. While net interest income, which is earned by charging higher rates on loans than paid on deposits, forms the foundation, fee-based services across banking, credit, wealth management, and trading operations provide additional income.
Over the last five years, OceanFirst Financial grew its revenue at a mediocre 3.2% compounded annual growth rate. This was below our standard for the bank sector and is a poor baseline for our analysis.
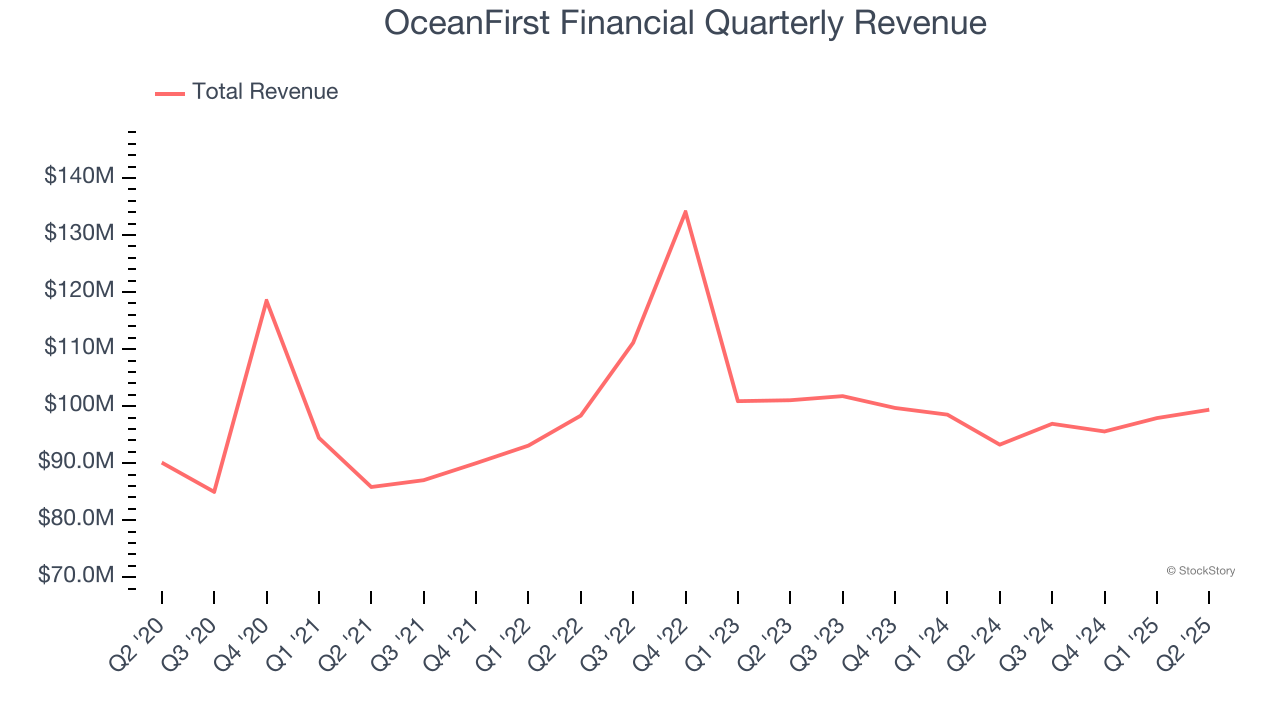
Long-term growth is the most important, but within financials, a half-decade historical view may miss recent interest rate changes and market returns. OceanFirst Financial’s performance shows it grew in the past but relinquished its gains over the last two years, as its revenue fell by 6.6% annually. 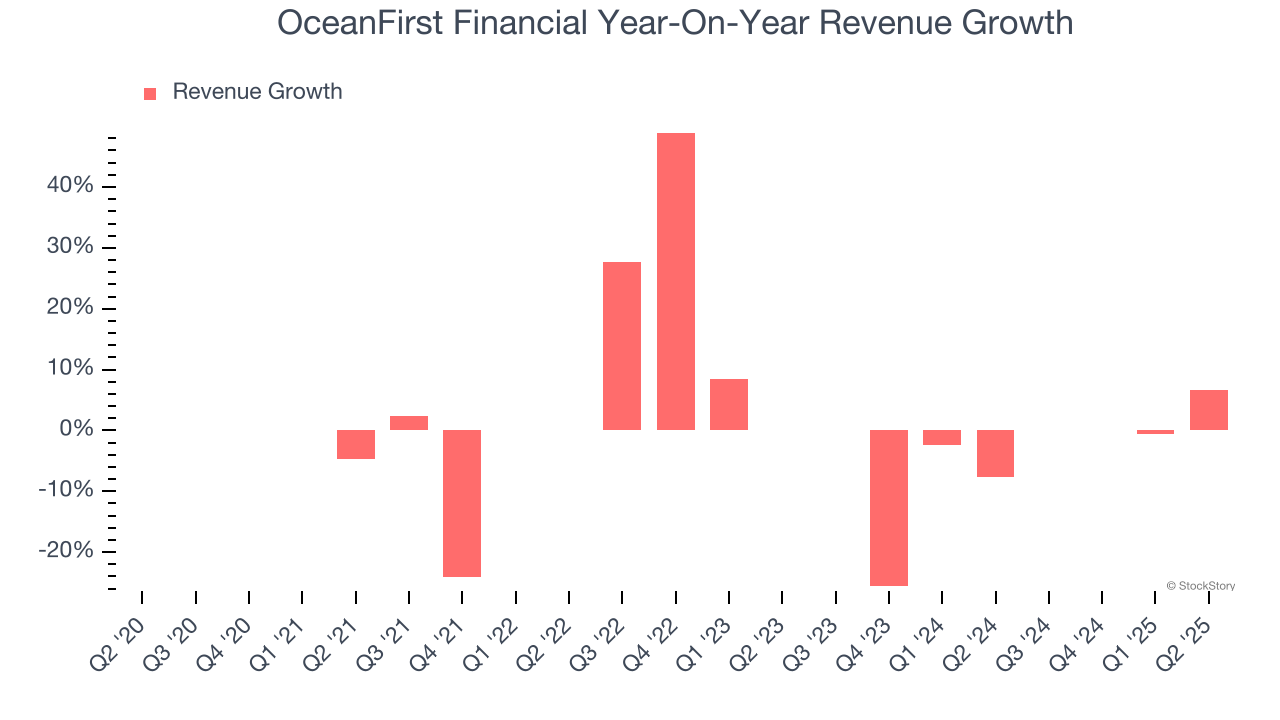 Note: Quarters not shown were determined to be outliers, impacted by outsized investment gains/losses that are not indicative of the recurring fundamentals of the business.
This quarter, OceanFirst Financial’s revenue grew by 6.6% year on year to $99.37 million, missing Wall Street’s estimates.
Net interest income made up 86.9% of the company’s total revenue during the last five years, meaning OceanFirst Financial barely relies on non-interest income to drive its overall growth.
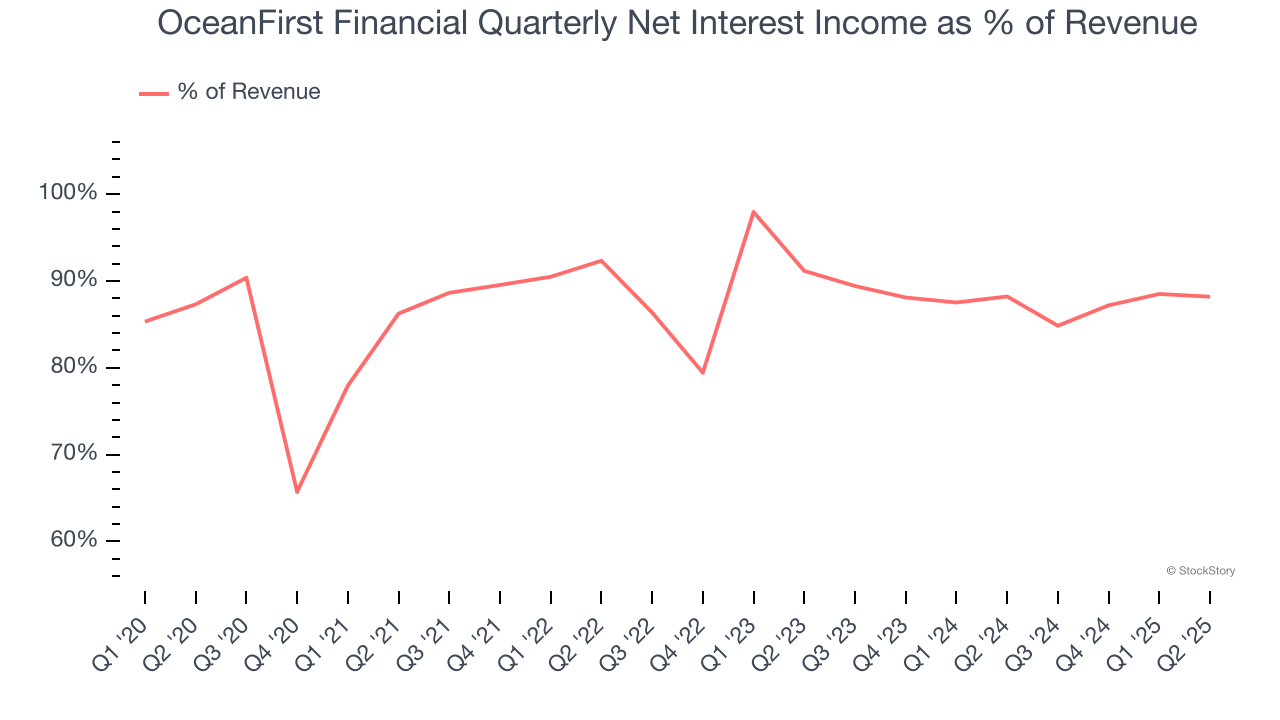
Markets consistently prioritize net interest income growth over fee-based revenue, recognizing its superior quality and recurring nature compared to the more unpredictable non-interest income streams.
Here at StockStory, we certainly understand the potential of thematic investing. Diverse winners from Microsoft (MSFT) to Alphabet (GOOG), Coca-Cola (KO) to Monster Beverage (MNST) could all have been identified as promising growth stories with a megatrend driving the growth. So, in that spirit, we’ve identified a relatively under-the-radar profitable growth stock benefiting from the rise of AI, available to you FREE via this link.
Tangible Book Value Per Share (TBVPS)
The balance sheet drives banking profitability since earnings flow from the spread between borrowing and lending rates. As such, valuations for these companies concentrate on capital strength and sustainable equity accumulation potential.
This explains why tangible book value per share (TBVPS) stands as the premier banking metric. TBVPS strips away questionable intangible assets, revealing concrete per-share net worth that investors can trust. Traditional metrics like EPS are helpful but face distortion from M&A activity and loan loss accounting rules.
OceanFirst Financial’s TBVPS grew at a mediocre 4.1% annual clip over the last five years. TBVPS growth has also recently decelerated a bit to 1.9% annual growth over the last two years (from $18.64 to $19.34 per share).
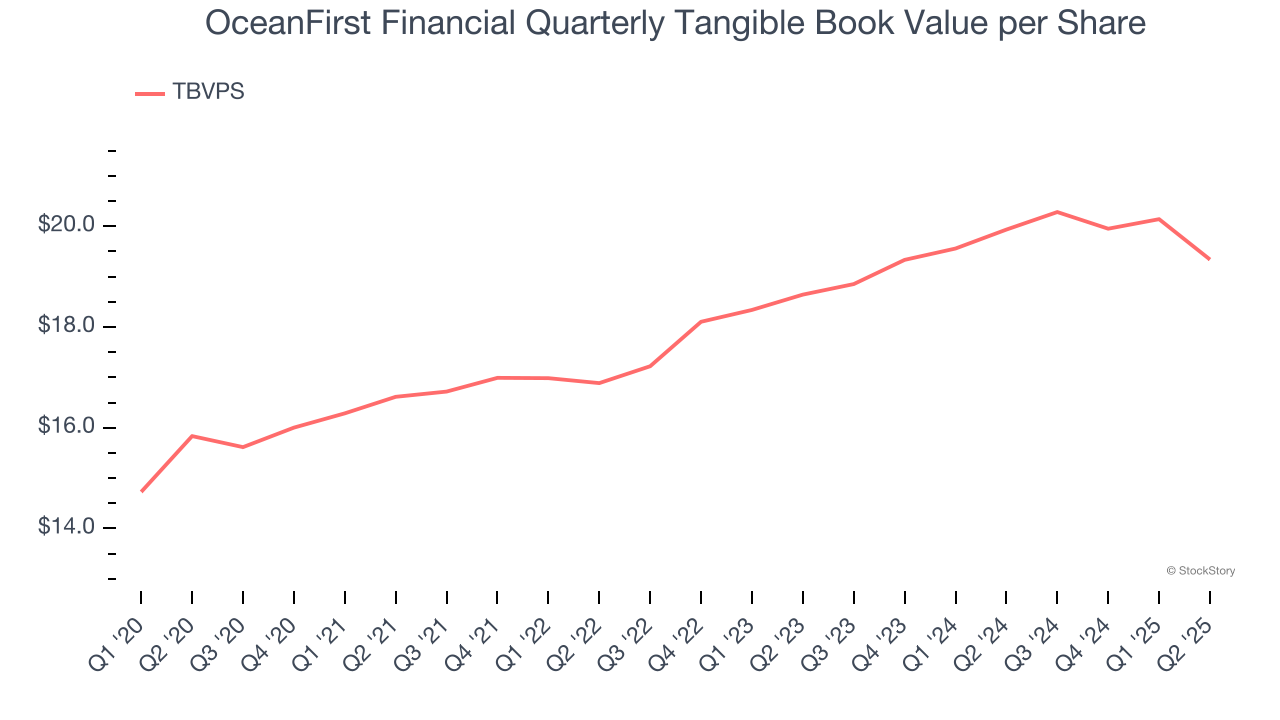
Over the next 12 months, Consensus estimates call for OceanFirst Financial’s TBVPS to grow by 4.1% to $20.14, paltry growth rate.
Key Takeaways from OceanFirst Financial’s Q2 Results
We struggled to find many positives in these results as OceanFirst fell short of Wall Street’s estimates across the board. Overall, this quarter could have been better. The stock remained flat at $17.89 immediately following the results.
Should you buy the stock or not? When making that decision, it’s important to consider its valuation, business qualities, as well as what has happened in the latest quarter. We cover that in our actionable full research report which you can read here, it’s free.


