
Commercial rental vehicle and delivery company Ryder (NYSE: R) reported Q2 CY2025 results topping the market’s revenue expectations, but sales were flat year on year at $3.19 billion. Its GAAP profit of $3.15 per share was 9.3% above analysts’ consensus estimates.
Is now the time to buy Ryder? Find out by accessing our full research report, it’s free.
Ryder (R) Q2 CY2025 Highlights:
- Revenue: $3.19 billion vs analyst estimates of $3.16 billion (flat year on year, 0.8% beat)
- EPS (GAAP): $3.15 vs analyst estimates of $2.88 (9.3% beat)
- Operating Margin: 8.9%, in line with the same quarter last year
- Market Capitalization: $7.14 billion
"The Ryder team delivered our third consecutive quarter of double-digit growth in earnings per share," says Ryder Chairman and CEO Robert Sanchez.
Company Overview
As one of the first companies to introduce the idea of leasing trucks, Ryder (NYSE: R) provides rental vehicles to businesses and delivers packages directly to homes or businesses.
Revenue Growth
A company’s long-term performance is an indicator of its overall quality. Any business can experience short-term success, but top-performing ones enjoy sustained growth for years. Thankfully, Ryder’s 8.2% annualized revenue growth over the last five years was decent. Its growth was slightly above the average industrials company and shows its offerings resonate with customers.
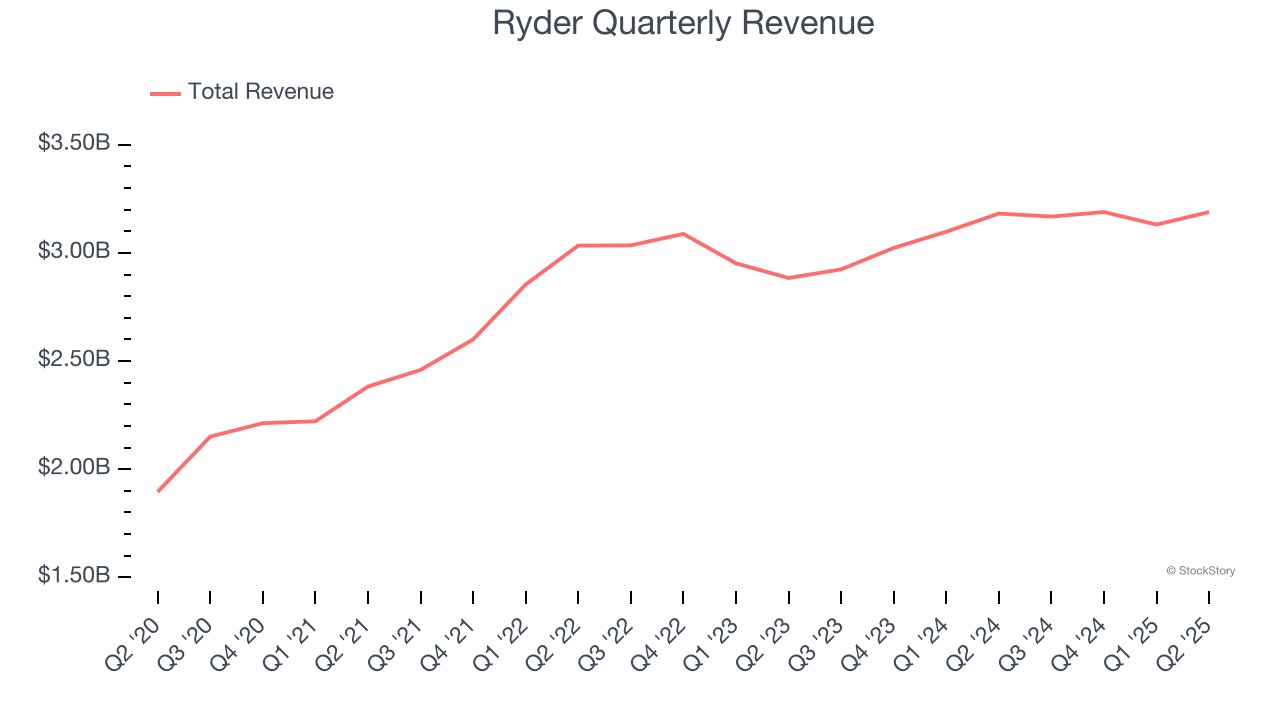
We at StockStory place the most emphasis on long-term growth, but within industrials, a half-decade historical view may miss cycles, industry trends, or a company capitalizing on catalysts such as a new contract win or a successful product line. Ryder’s recent performance shows its demand has slowed as its annualized revenue growth of 3% over the last two years was below its five-year trend. We also note many other Ground Transportation businesses have faced declining sales because of cyclical headwinds. While Ryder grew slower than we’d like, it did do better than its peers. 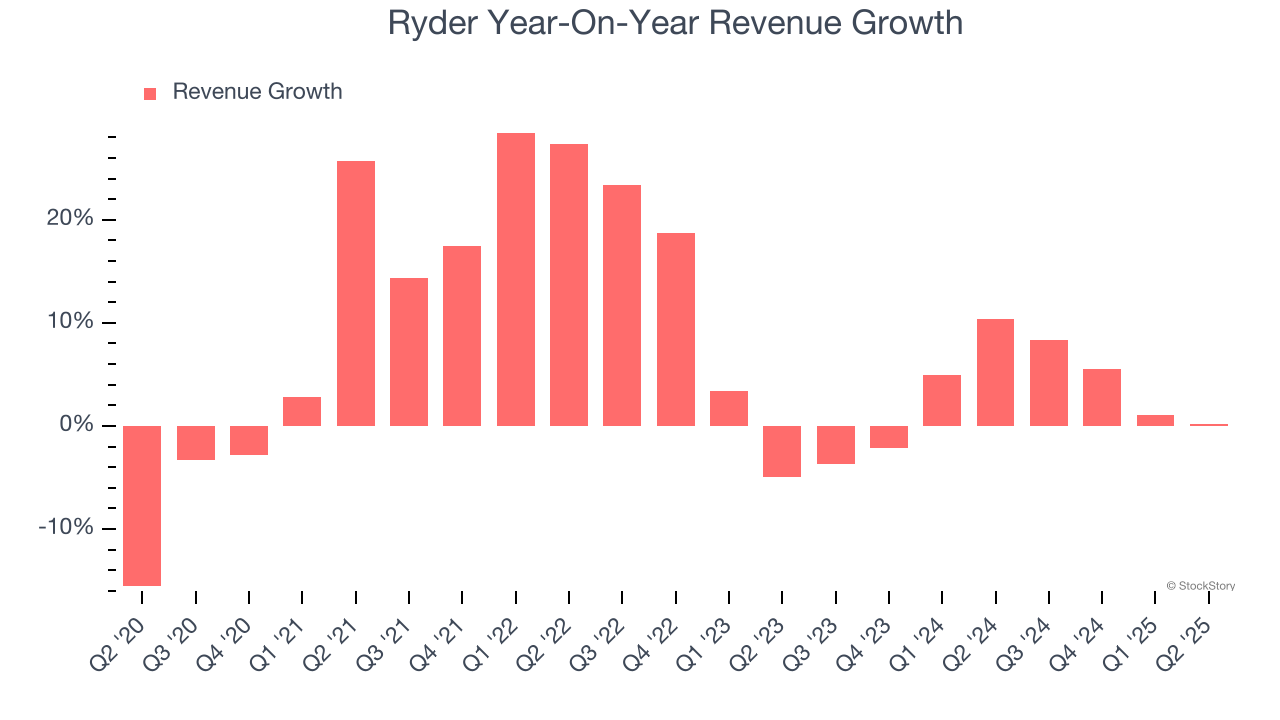
We can dig further into the company’s revenue dynamics by analyzing its most important segments, Fleet Management Solutions and Supply Chain Solutions, which are 46% and 42.8% of revenue. Over the last two years, Ryder’s Fleet Management Solutions revenue (leasing and rental) averaged 2.2% year-on-year declines. On the other hand, its Supply Chain Solutions revenue ( designing and managing customers' distribution) averaged 5.3% growth.
This quarter, Ryder’s $3.19 billion of revenue was flat year on year but beat Wall Street’s estimates by 0.8%.
Looking ahead, sell-side analysts expect revenue to grow 2.9% over the next 12 months, similar to its two-year rate. This projection doesn't excite us and indicates its newer products and services will not catalyze better top-line performance yet.
Software is eating the world and there is virtually no industry left that has been untouched by it. That drives increasing demand for tools helping software developers do their jobs, whether it be monitoring critical cloud infrastructure, integrating audio and video functionality, or ensuring smooth content streaming. Click here to access a free report on our 3 favorite stocks to play this generational megatrend.
Operating Margin
Ryder was profitable over the last five years but held back by its large cost base. Its average operating margin of 7.8% was weak for an industrials business. This result isn’t too surprising given its low gross margin as a starting point.
On the plus side, Ryder’s operating margin rose by 2.5 percentage points over the last five years, as its sales growth gave it operating leverage. We’ll take Ryder’s improvement as many Ground Transportation companies saw their margins fall (along with revenue, as mentioned above) because the cycle turned in the wrong direction.
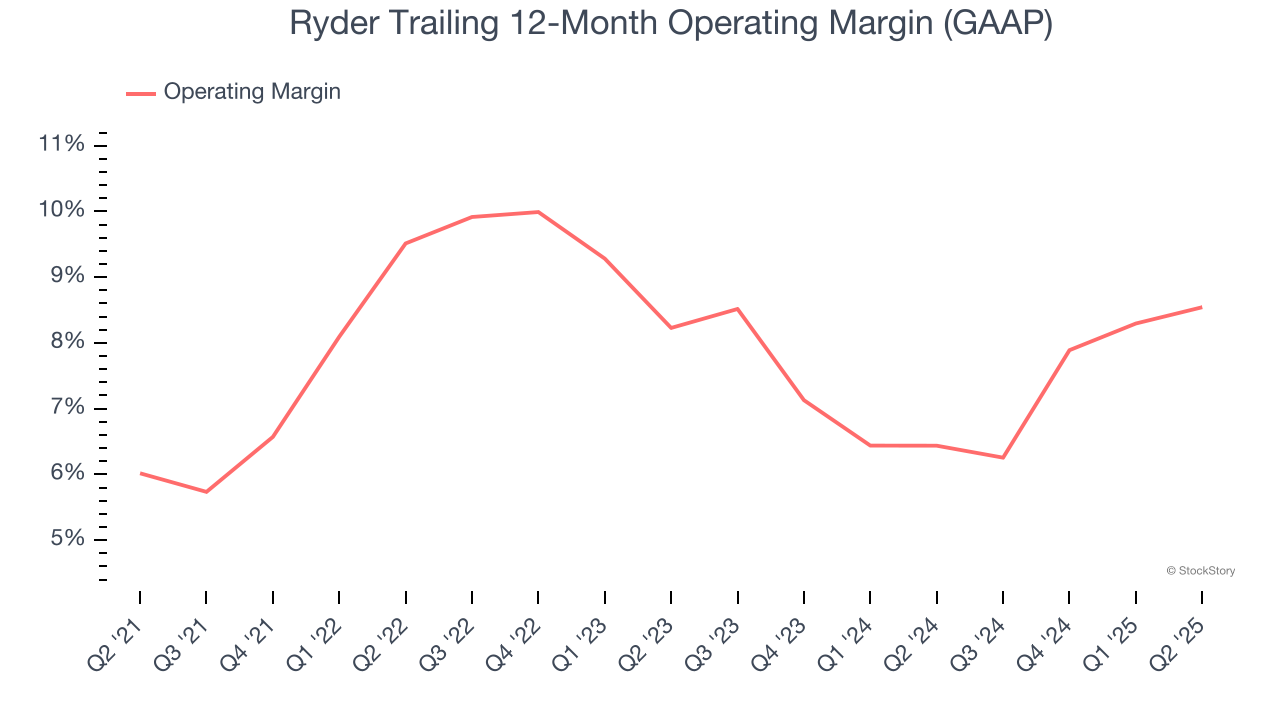
This quarter, Ryder generated an operating margin profit margin of 8.9%, in line with the same quarter last year. This indicates the company’s cost structure has recently been stable.
Earnings Per Share
Revenue trends explain a company’s historical growth, but the long-term change in earnings per share (EPS) points to the profitability of that growth – for example, a company could inflate its sales through excessive spending on advertising and promotions.
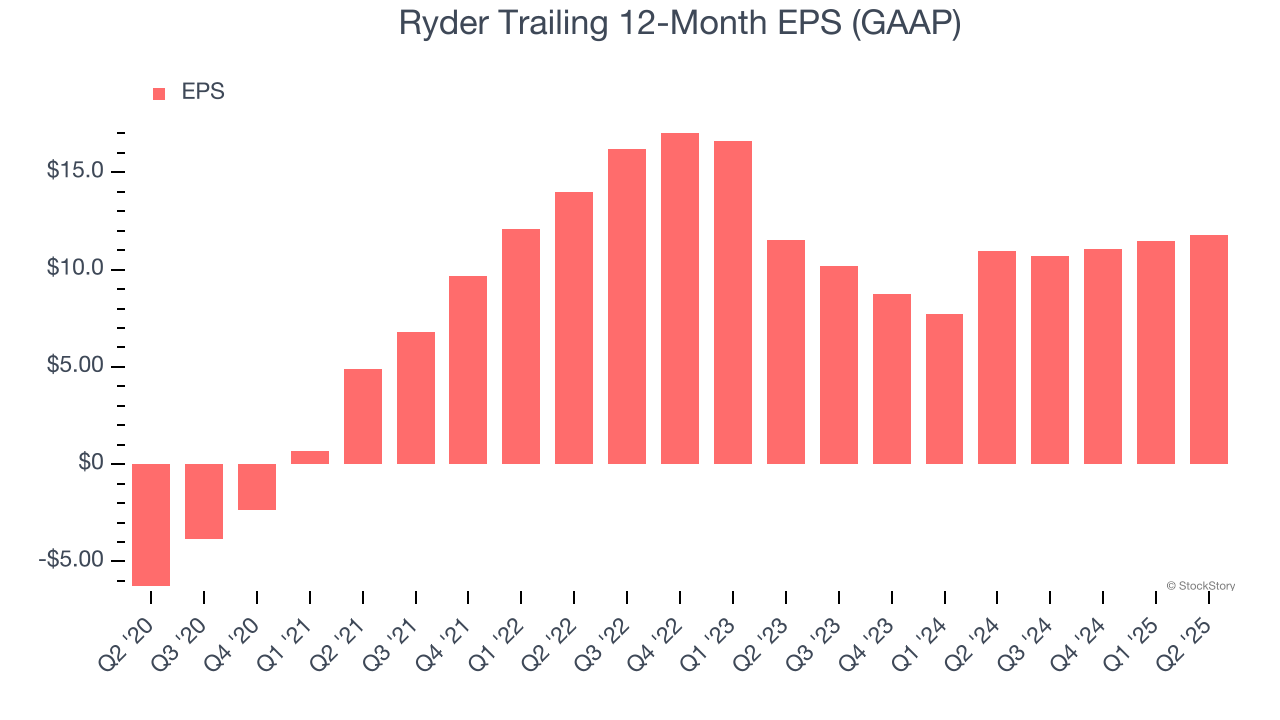
Ryder’s full-year EPS flipped from negative to positive over the last five years. This is encouraging and shows it’s at a critical moment in its life.
Like with revenue, we analyze EPS over a shorter period to see if we are missing a change in the business.
Ryder’s weak 1.1% annual EPS growth over the last two years aligns with its revenue trend. This tells us it maintained its per-share profitability as it expanded.
In Q2, Ryder reported EPS at $3.15, up from $2.85 in the same quarter last year. This print beat analysts’ estimates by 9.3%. We also like to analyze expected EPS growth based on Wall Street analysts’ consensus projections, but there is insufficient data.
Key Takeaways from Ryder’s Q2 Results
It was good to see Ryder beat analysts’ Fleet Management Solutions revenue expectations this quarter. We were also happy its EPS outperformed Wall Street’s estimates. Overall, this print had some key positives. The stock traded up 2.1% to $176.39 immediately following the results.
Ryder may have had a good quarter, but does that mean you should invest right now? The latest quarter does matter, but not nearly as much as longer-term fundamentals and valuation, when deciding if the stock is a buy. We cover that in our actionable full research report which you can read here, it’s free.


