Freight transportation company Union Pacific (NYSE: UNP) met Wall Street’s revenue expectations in Q2 CY2025, with sales up 2.4% year on year to $6.15 billion. Its non-GAAP profit of $3.03 per share was 4.6% above analysts’ consensus estimates.
Is now the time to buy Union Pacific? Find out by accessing our full research report, it’s free.
Union Pacific (UNP) Q2 CY2025 Highlights:
- Revenue: $6.15 billion vs analyst estimates of $6.15 billion (2.4% year-on-year growth, in line)
- Adjusted EPS: $3.03 vs analyst estimates of $2.90 (4.6% beat)
- Operating Margin: 41%, up from 40% in the same quarter last year
- Free Cash Flow Margin: 36.3%, up from 5.5% in the same quarter last year
- Market Capitalization: $138 billion
Company Overview
Part of the transcontinental railroad project, Union Pacific (NYSE: UNP) is a freight transportation company that operates a major railroad network.
Revenue Growth
A company’s long-term sales performance is one signal of its overall quality. Any business can have short-term success, but a top-tier one grows for years. Unfortunately, Union Pacific’s 3.8% annualized revenue growth over the last five years was sluggish. This was below our standard for the industrials sector and is a rough starting point for our analysis.
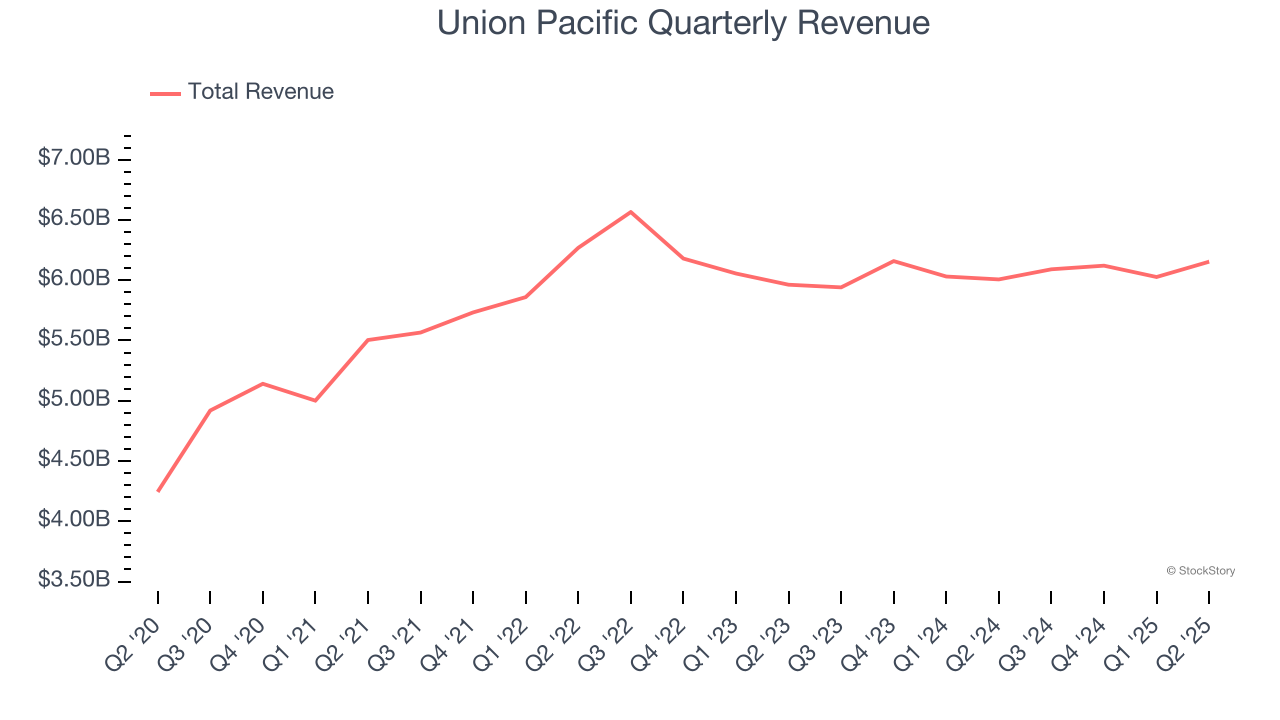
Long-term growth is the most important, but within industrials, a half-decade historical view may miss new industry trends or demand cycles. Union Pacific’s recent performance shows its demand has slowed as its revenue was flat over the last two years. We also note many other Rail Transportation businesses have faced declining sales because of cyclical headwinds. While Union Pacific’s growth wasn’t the best, it did do better than its peers. 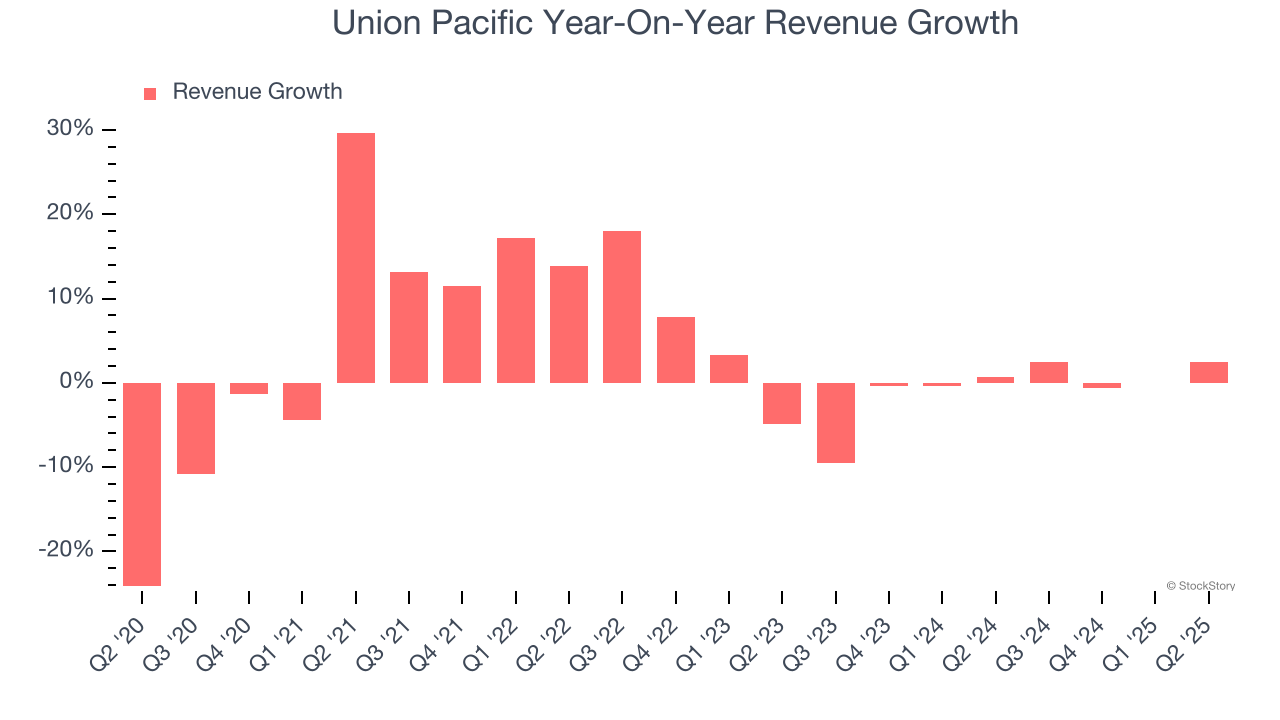
This quarter, Union Pacific grew its revenue by 2.4% year on year, and its $6.15 billion of revenue was in line with Wall Street’s estimates.
Looking ahead, sell-side analysts expect revenue to grow 3% over the next 12 months. Although this projection indicates its newer products and services will catalyze better top-line performance, it is still below average for the sector.
Here at StockStory, we certainly understand the potential of thematic investing. Diverse winners from Microsoft (MSFT) to Alphabet (GOOG), Coca-Cola (KO) to Monster Beverage (MNST) could all have been identified as promising growth stories with a megatrend driving the growth. So, in that spirit, we’ve identified a relatively under-the-radar profitable growth stock benefiting from the rise of AI, available to you FREE via this link.
Operating Margin
Union Pacific has been a well-oiled machine over the last five years. It demonstrated elite profitability for an industrials business, boasting an average operating margin of 40.1%. This result isn’t surprising as its high gross margin gives it a favorable starting point.
Analyzing the trend in its profitability, Union Pacific’s operating margin decreased by 1 percentage points over the last five years. Many Rail Transportation companies also saw their margins fall (along with revenue, as mentioned above) because the cycle turned in the wrong direction. We hope Union Pacific can emerge from this a stronger company, as the silver lining of a downturn is that market share can be won and efficiencies found.
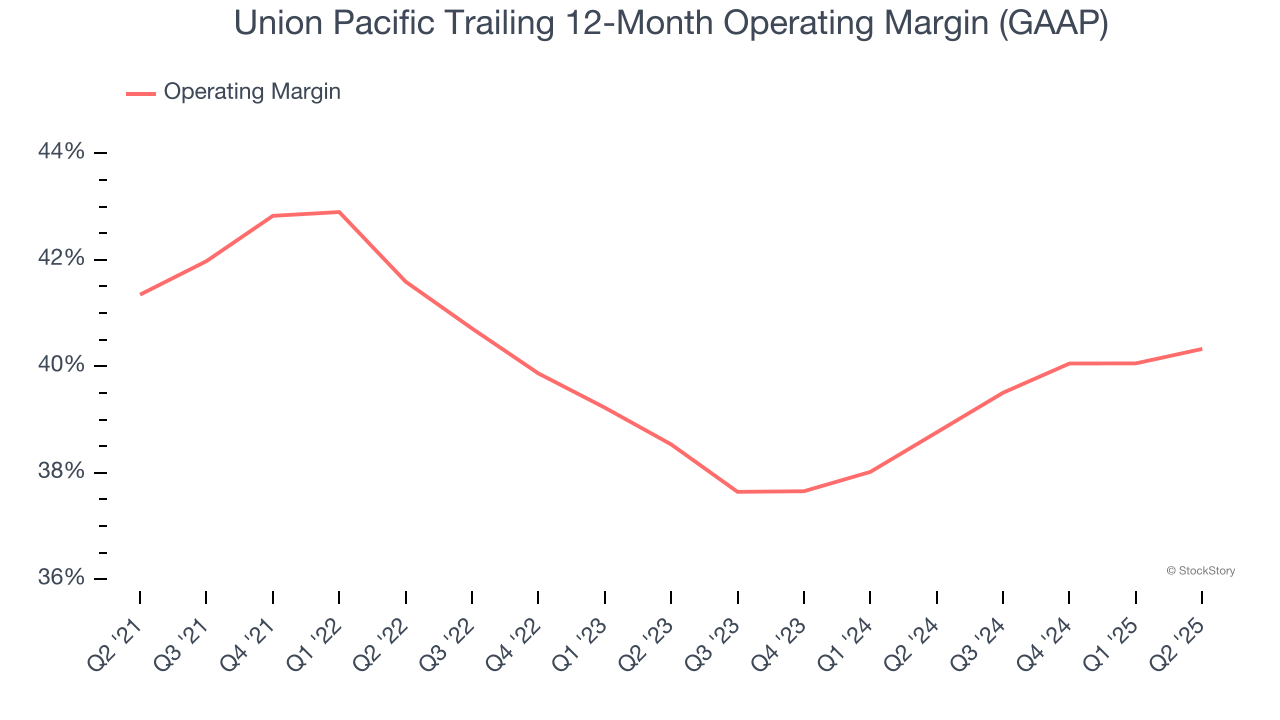
This quarter, Union Pacific generated an operating margin profit margin of 41%, up 1.1 percentage points year on year. The increase was encouraging, and because its operating margin rose more than its gross margin, we can infer it was more efficient with expenses such as marketing, R&D, and administrative overhead.
Earnings Per Share
We track the long-term change in earnings per share (EPS) for the same reason as long-term revenue growth. Compared to revenue, however, EPS highlights whether a company’s growth is profitable.
Union Pacific’s EPS grew at an unimpressive 7.3% compounded annual growth rate over the last five years. On the bright side, this performance was better than its 3.8% annualized revenue growth and tells us the company became more profitable on a per-share basis as it expanded.
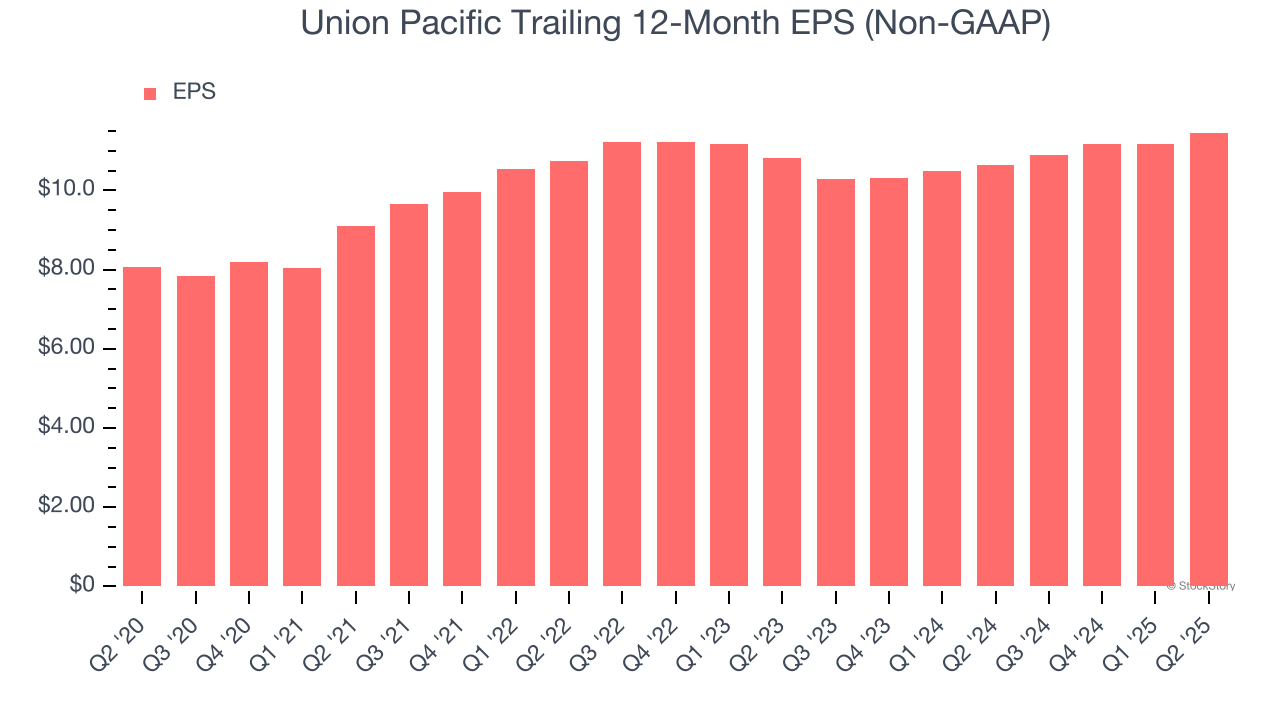
We can take a deeper look into Union Pacific’s earnings to better understand the drivers of its performance. A five-year view shows that Union Pacific has repurchased its stock, shrinking its share count by 12.4%. This tells us its EPS outperformed its revenue not because of increased operational efficiency but financial engineering, as buybacks boost per share earnings. 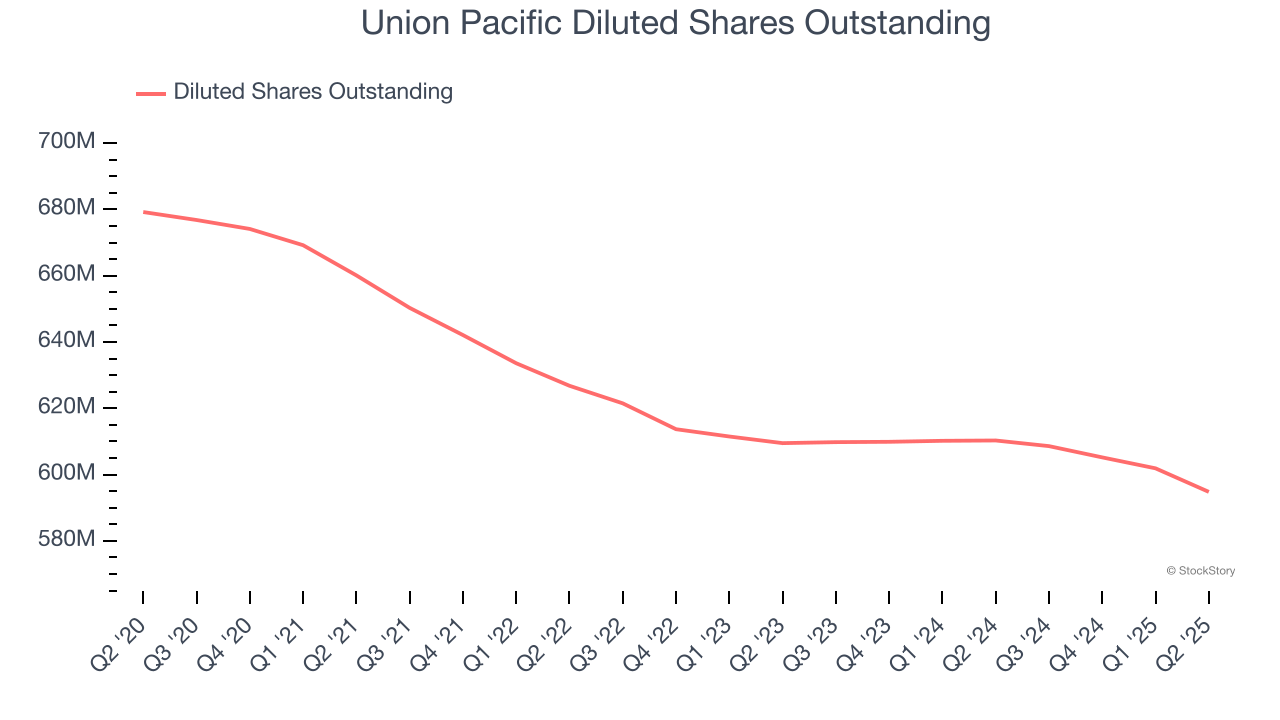
Like with revenue, we analyze EPS over a shorter period to see if we are missing a change in the business.
For Union Pacific, its two-year annual EPS growth of 2.9% was lower than its five-year trend. We hope its growth can accelerate in the future.
In Q2, Union Pacific reported EPS at $3.03, up from $2.74 in the same quarter last year. This print beat analysts’ estimates by 4.6%. Over the next 12 months, Wall Street expects Union Pacific’s full-year EPS of $11.46 to grow 5.7%.
Key Takeaways from Union Pacific’s Q2 Results
It was encouraging to see Union Pacific beat analysts’ EPS expectations this quarter. Zooming out, we think this was a decent quarter. The stock remained flat at $229.84 immediately following the results.
Is Union Pacific an attractive investment opportunity at the current price? The latest quarter does matter, but not nearly as much as longer-term fundamentals and valuation, when deciding if the stock is a buy. We cover that in our actionable full research report which you can read here, it’s free.