Rail equipment company Westinghouse Air Brake Technologies (NYSE: WAB) missed Wall Street’s revenue expectations in Q2 CY2025 as sales rose 2.3% year on year to $2.71 billion. On the other hand, the company’s full-year revenue guidance of $11.08 billion at the midpoint came in 0.8% above analysts’ estimates. Its non-GAAP profit of $2.27 per share was 4.1% above analysts’ consensus estimates.
Is now the time to buy Wabtec? Find out by accessing our full research report, it’s free.
Wabtec (WAB) Q2 CY2025 Highlights:
- Revenue: $2.71 billion vs analyst estimates of $2.78 billion (2.3% year-on-year growth, 2.5% miss)
- Adjusted EPS: $2.27 vs analyst estimates of $2.18 (4.1% beat)
- Adjusted EBITDA: $608 million vs analyst estimates of $609.8 million (22.5% margin, in line)
- The company lifted its revenue guidance for the full year to $11.08 billion at the midpoint from $10.88 billion, a 1.8% increase
- Management raised its full-year Adjusted EPS guidance to $8.85 at the midpoint, a 2.3% increase
- Operating Margin: 17.4%, up from 16.3% in the same quarter last year
- Backlog: $21.83 billion at quarter end
- Organic Revenue was flat year on year (9.2% in the same quarter last year)
- Market Capitalization: $36.69 billion
“The Wabtec team has delivered another strong quarter, highlighted by margin expansion and double digit earnings per share growth,” said Rafael Santana, Wabtec’s President and CEO.
Company Overview
Also known as Wabtec, Westinghouse Air Brake Technologies (NYSE: WAB) provides equipment, systems, and related software for the railway industry.
Revenue Growth
A company’s long-term performance is an indicator of its overall quality. Any business can put up a good quarter or two, but many enduring ones grow for years. Over the last five years, Wabtec grew its sales at a tepid 5.6% compounded annual growth rate. This wasn’t a great result compared to the rest of the industrials sector, but there are still things to like about Wabtec.
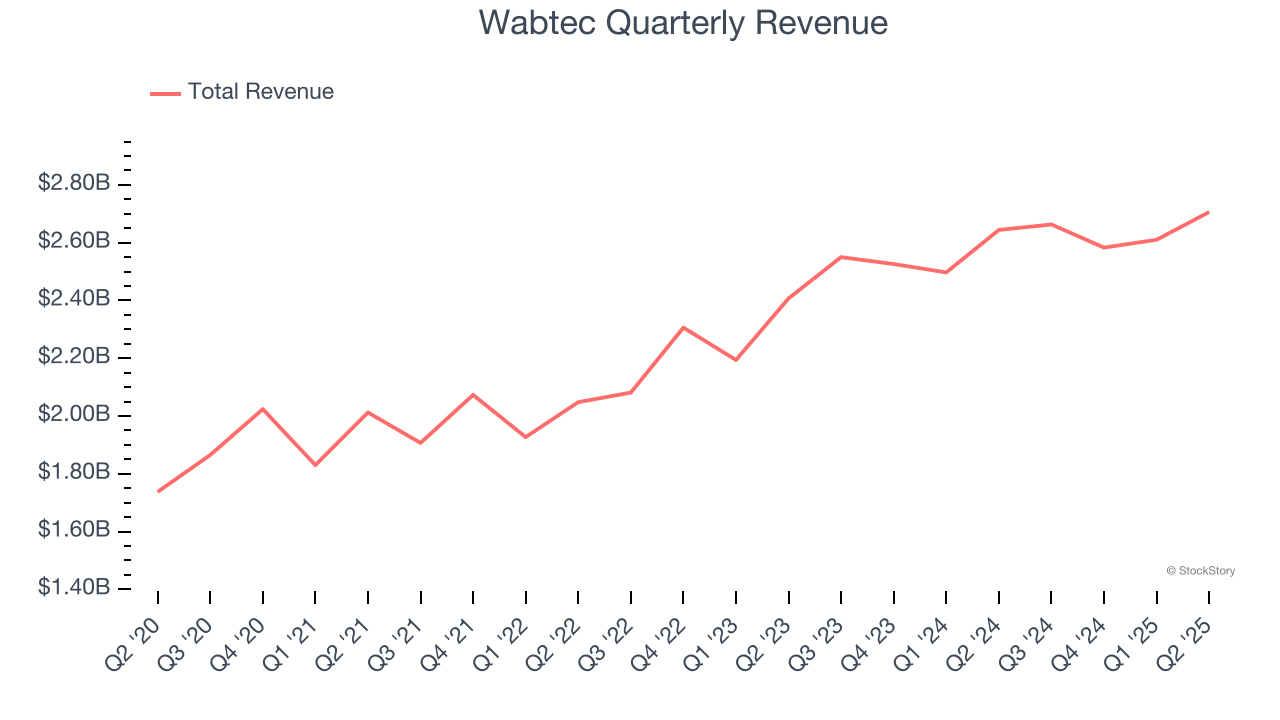
Long-term growth is the most important, but within industrials, a half-decade historical view may miss new industry trends or demand cycles. Wabtec’s annualized revenue growth of 8.4% over the last two years is above its five-year trend, suggesting some bright spots. We also think Wabtec’s is one of the better Heavy Transportation Equipment businesses as many of its peers faced declining sales because of cyclical headwinds. 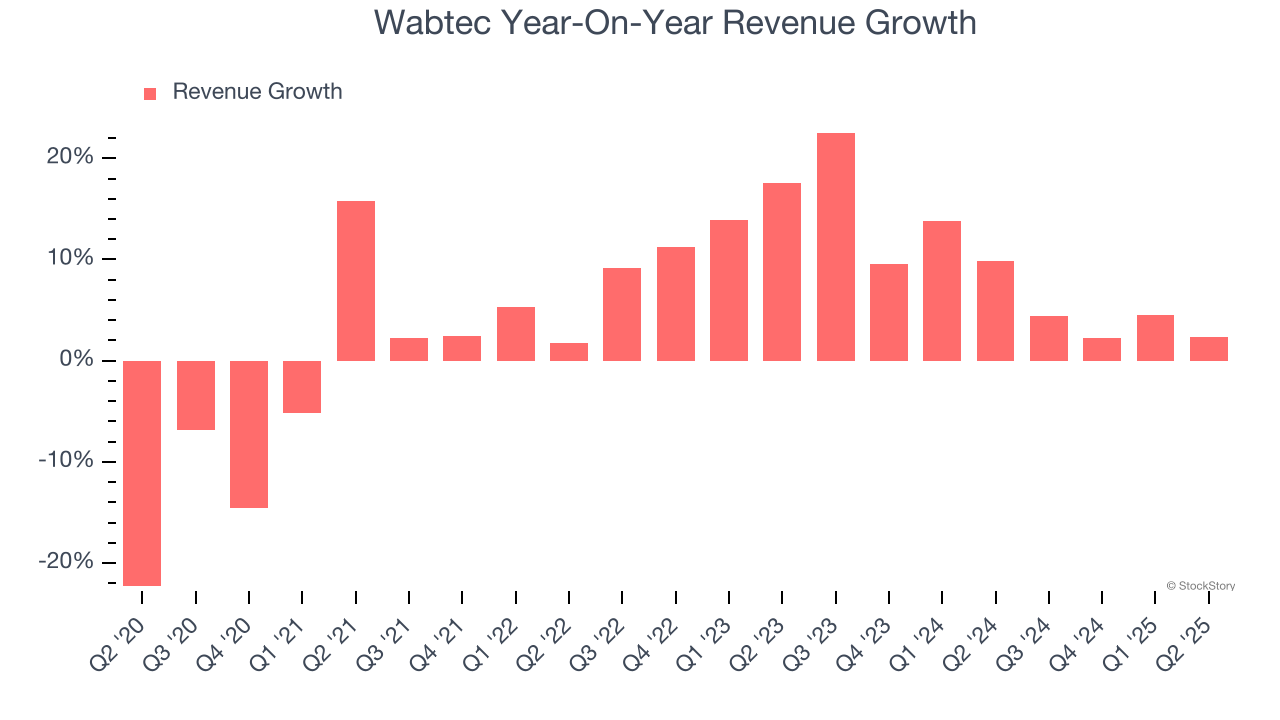
We can dig further into the company’s sales dynamics by analyzing its organic revenue, which strips out one-time events like acquisitions and currency fluctuations that don’t accurately reflect its fundamentals. Over the last two years, Wabtec’s organic revenue averaged 7.4% year-on-year growth. Because this number aligns with its normal revenue growth, we can see the company’s core operations (not acquisitions and divestitures) drove most of its results. 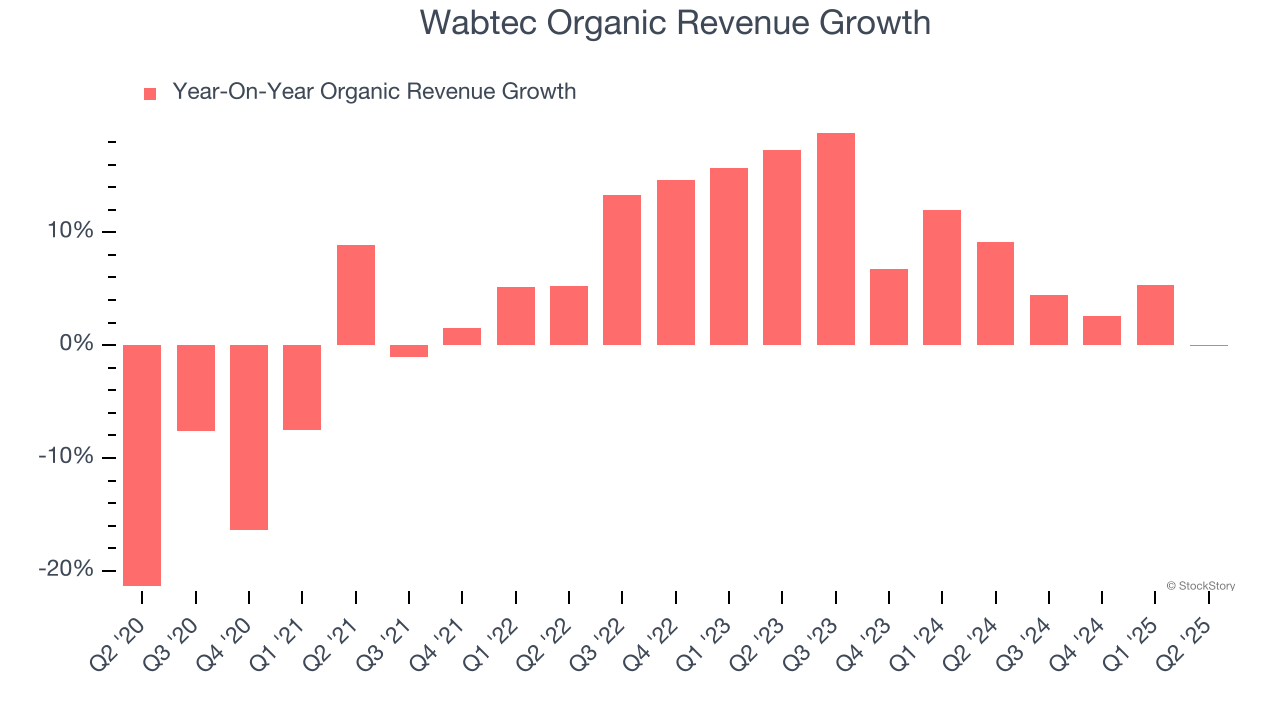
This quarter, Wabtec’s revenue grew by 2.3% year on year to $2.71 billion, falling short of Wall Street’s estimates.
Looking ahead, sell-side analysts expect revenue to grow 8.2% over the next 12 months, similar to its two-year rate. This projection is above average for the sector and implies its newer products and services will help maintain its recent top-line performance.
Software is eating the world and there is virtually no industry left that has been untouched by it. That drives increasing demand for tools helping software developers do their jobs, whether it be monitoring critical cloud infrastructure, integrating audio and video functionality, or ensuring smooth content streaming. Click here to access a free report on our 3 favorite stocks to play this generational megatrend.
Operating Margin
Operating margin is one of the best measures of profitability because it tells us how much money a company takes home after procuring and manufacturing its products, marketing and selling those products, and most importantly, keeping them relevant through research and development.
Wabtec has been an efficient company over the last five years. It was one of the more profitable businesses in the industrials sector, boasting an average operating margin of 13.4%.
Looking at the trend in its profitability, Wabtec’s operating margin rose by 6.4 percentage points over the last five years, as its sales growth gave it operating leverage.
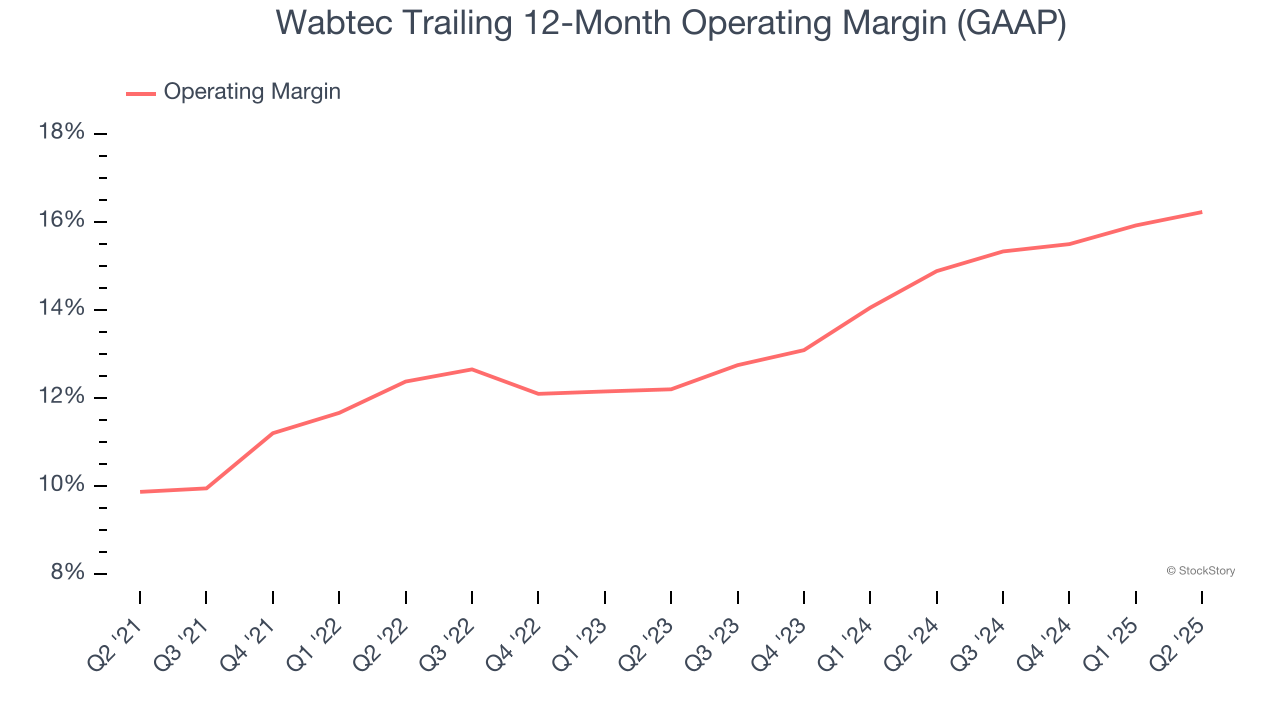
This quarter, Wabtec generated an operating margin profit margin of 17.4%, up 1.2 percentage points year on year. Since its gross margin expanded more than its operating margin, we can infer that leverage on its cost of sales was the primary driver behind the recently higher efficiency.
Earnings Per Share
We track the long-term change in earnings per share (EPS) for the same reason as long-term revenue growth. Compared to revenue, however, EPS highlights whether a company’s growth is profitable.
Wabtec’s EPS grew at a spectacular 16% compounded annual growth rate over the last five years, higher than its 5.6% annualized revenue growth. This tells us the company became more profitable on a per-share basis as it expanded.
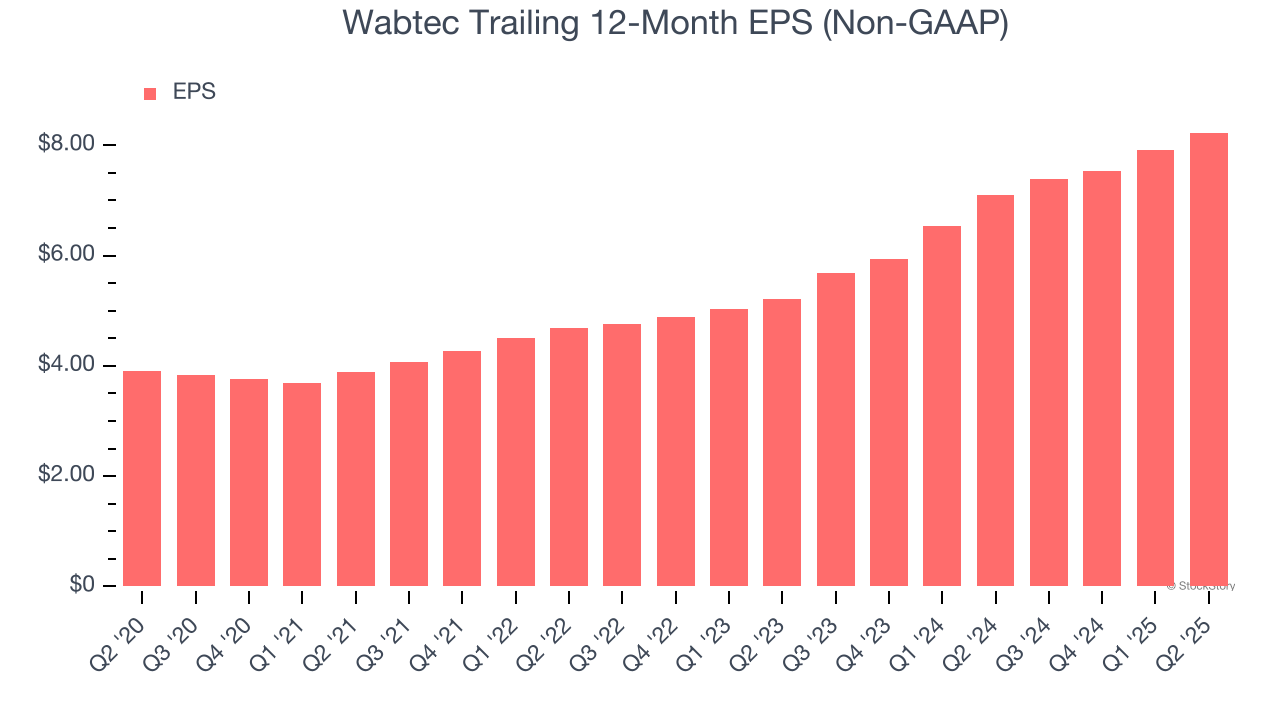
Diving into the nuances of Wabtec’s earnings can give us a better understanding of its performance. As we mentioned earlier, Wabtec’s operating margin expanded by 6.4 percentage points over the last five years. On top of that, its share count shrank by 10%. These are positive signs for shareholders because improving profitability and share buybacks turbocharge EPS growth relative to revenue growth. 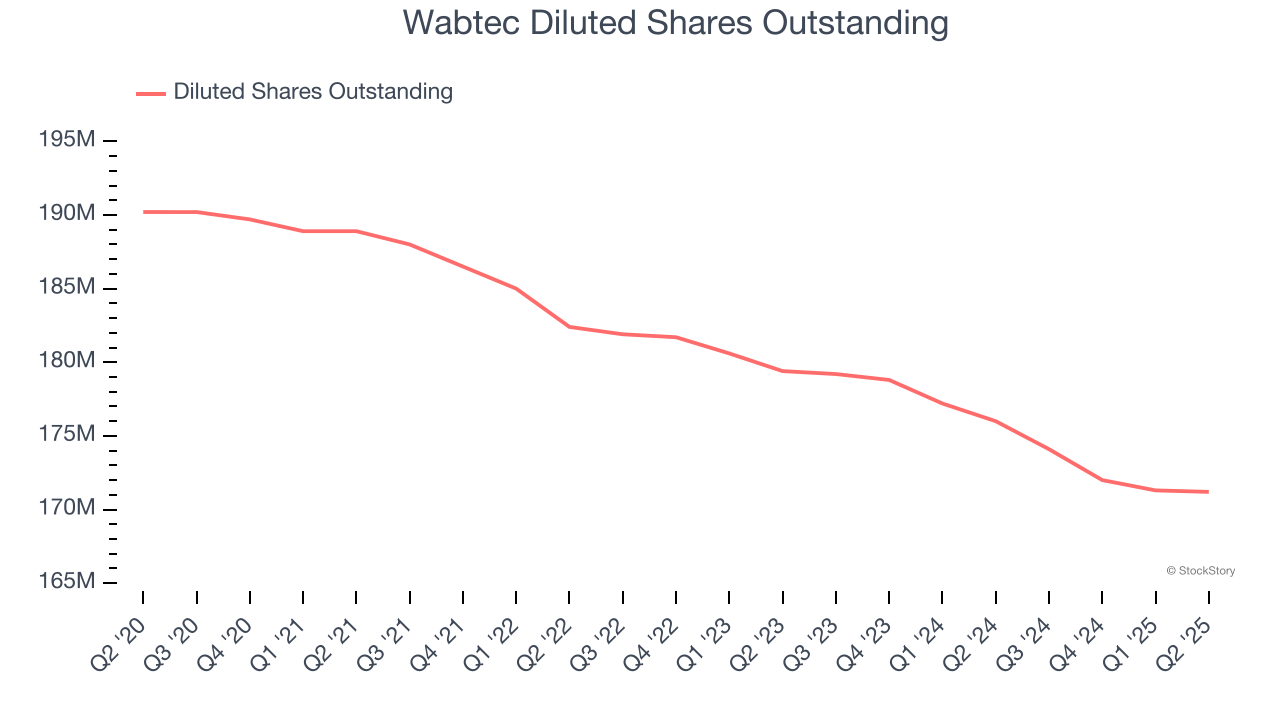
Like with revenue, we analyze EPS over a more recent period because it can provide insight into an emerging theme or development for the business.
For Wabtec, its two-year annual EPS growth of 25.7% was higher than its five-year trend. We love it when earnings growth accelerates, especially when it accelerates off an already high base.
In Q2, Wabtec reported EPS at $2.27, up from $1.96 in the same quarter last year. This print beat analysts’ estimates by 4.1%. We also like to analyze expected EPS growth based on Wall Street analysts’ consensus projections, but there is insufficient data.
Key Takeaways from Wabtec’s Q2 Results
It was good to see Wabtec provide full-year EPS guidance that slightly beat analysts’ expectations. We were also glad its full-year revenue guidance slightly exceeded Wall Street’s estimates. On the other hand, its revenue missed and its organic revenue fell short of Wall Street’s estimates. Overall, this quarter was mixed. The stock remained flat at $214.39 immediately after reporting.
Wabtec may have had a tough quarter, but does that actually create an opportunity to invest right now? The latest quarter does matter, but not nearly as much as longer-term fundamentals and valuation, when deciding if the stock is a buy. We cover that in our actionable full research report which you can read here, it’s free.