
FTAI Infrastructure has been treading water for the past six months, recording a small loss of 4.6% while holding steady at $6.70. The stock also fell short of the S&P 500’s 5.8% gain during that period.
Does this present a buying opportunity for FIP? Or is its underperformance reflective of its story and business quality? Find out in our full research report, it’s free.
Why Does FIP Stock Spark Debate?
Spun off from FTAI Aviation in 2021, FTAI Infrastructure (NASDAQ: FIP) invests in and operates infrastructure and related assets across the transportation and energy sectors.
Two Things to Like:
1. Skyrocketing Revenue Shows Strong Momentum
Examining a company’s long-term performance can provide clues about its quality. Any business can have short-term success, but a top-tier one grows for years. Over the last three years, FTAI Infrastructure grew its sales at an incredible 33.3% compounded annual growth rate. Its growth surpassed the average industrials company and shows its offerings resonate with customers. 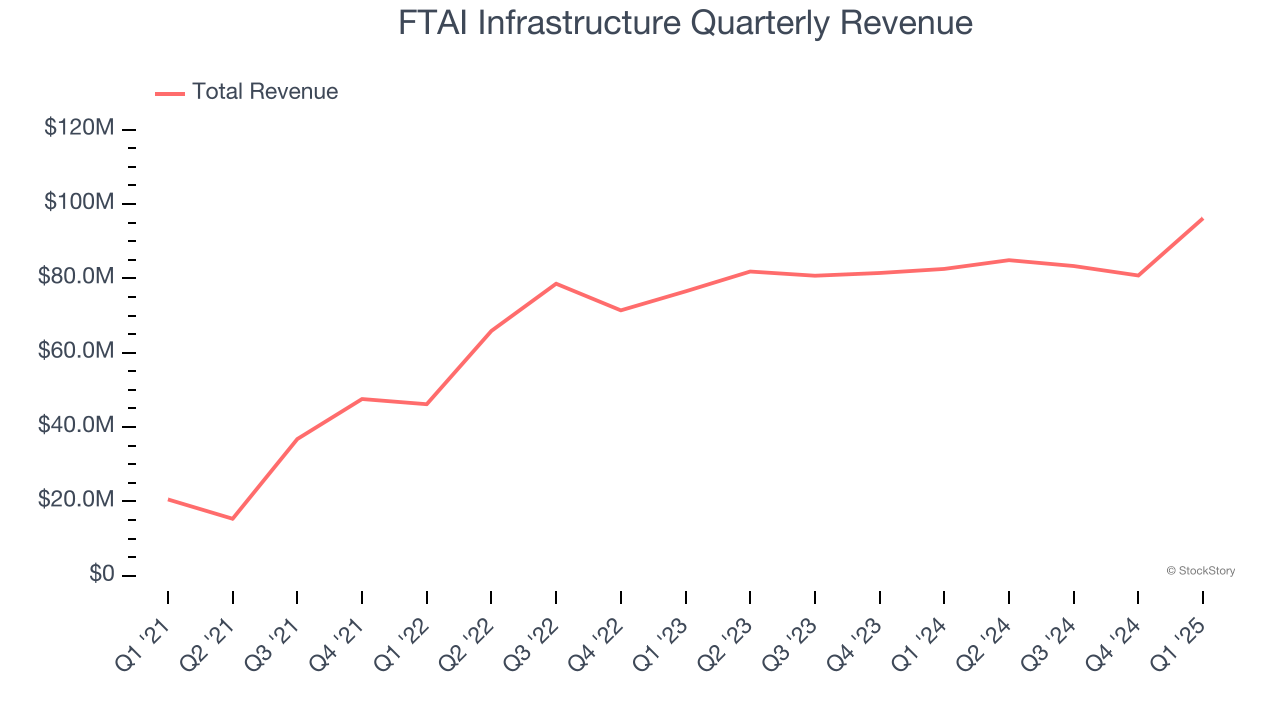
2. Projected Revenue Growth Is Remarkable
Forecasted revenues by Wall Street analysts signal a company’s potential. Predictions may not always be accurate, but accelerating growth typically boosts valuation multiples and stock prices while slowing growth does the opposite, though some deceleration is natural as businesses become larger.
Over the next 12 months, sell-side analysts expect FTAI Infrastructure’s revenue to rise by 78.2%, an improvement versus its 33.3% annualized growth for the past three years. This projection is eye-popping and indicates its newer products and services will fuel better top-line performance.
One Reason to be Careful:
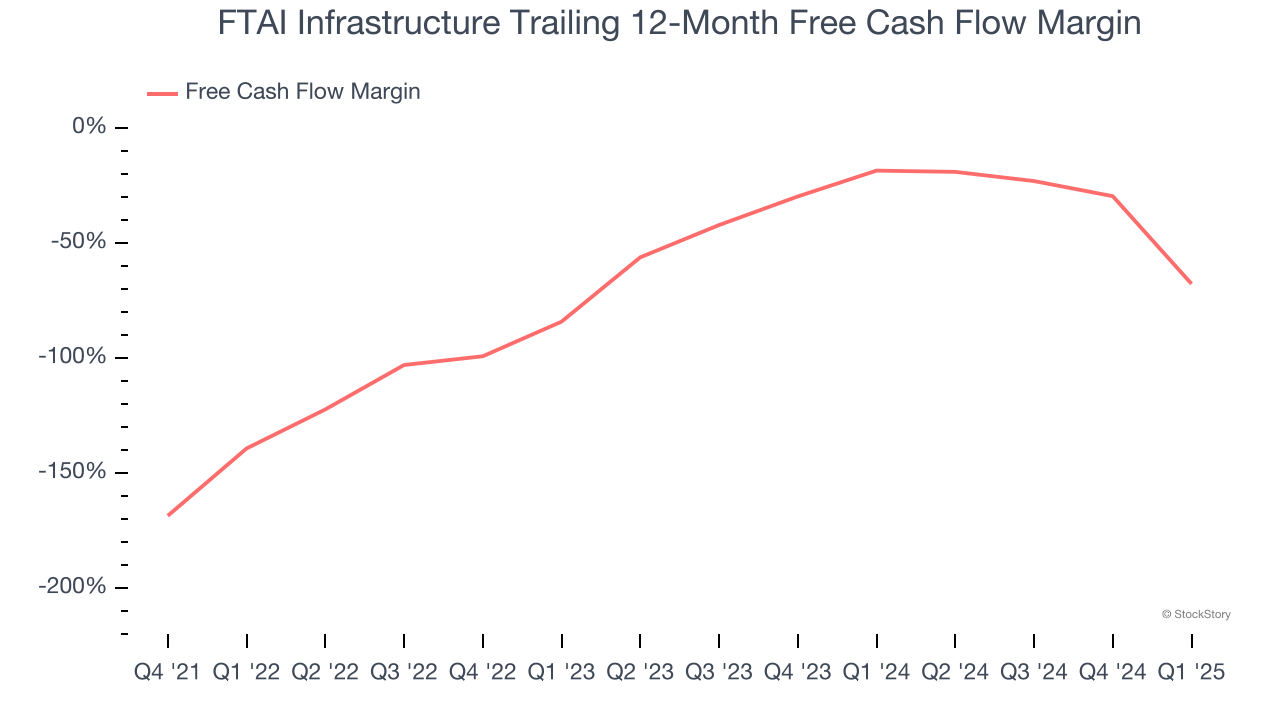
Cash Burn Ignites Concerns
If you’ve followed StockStory for a while, you know we emphasize free cash flow. Why, you ask? We believe that in the end, cash is king, and you can’t use accounting profits to pay the bills.
FTAI Infrastructure’s demanding reinvestments have drained its resources over the last five years, putting it in a pinch and limiting its ability to return capital to investors. Its free cash flow margin averaged negative 71.5%, meaning it lit $71.53 of cash on fire for every $100 in revenue.
Final Judgment
FTAI Infrastructure’s merits more than compensate for its flaws. With its shares trailing the market in recent months, the stock trades at 2.9× forward EV-to-EBITDA (or $6.70 per share). Is now a good time to initiate a position? See for yourself in our full research report, it’s free.
Stocks We Like Even More Than FTAI Infrastructure
Trump’s April 2024 tariff bombshell triggered a massive market selloff, but stocks have since staged an impressive recovery, leaving those who panic sold on the sidelines.
Take advantage of the rebound by checking out our Top 9 Market-Beating Stocks. This is a curated list of our High Quality stocks that have generated a market-beating return of 183% over the last five years (as of March 31st 2025).
Stocks that made our list in 2020 include now familiar names such as Nvidia (+1,545% between March 2020 and March 2025) as well as under-the-radar businesses like the once-small-cap company Comfort Systems (+782% five-year return). Find your next big winner with StockStory today.
StockStory is growing and hiring equity analyst and marketing roles. Are you a 0 to 1 builder passionate about the markets and AI? See the open roles here.


