Since July 2020, the S&P 500 has delivered a total return of 95.9%. But one standout stock has more than doubled the market - over the past five years, HCI Group has surged 212% to $138.18 per share. Its momentum hasn’t stopped as it’s also gained 13.3% in the last six months thanks to its solid quarterly results, beating the S&P by 7.4%.
Is now still a good time to buy HCI? Or are investors being too optimistic? Find out in our full research report, it’s free.
Why Are We Positive On HCI Group?
Starting as a Florida "take-out" insurer that assumed policies from the state-backed Citizens Property Insurance Corporation, HCI Group (NYSE: HCI) provides property and casualty insurance, primarily homeowners coverage, while leveraging proprietary technology to improve underwriting and claims processing.
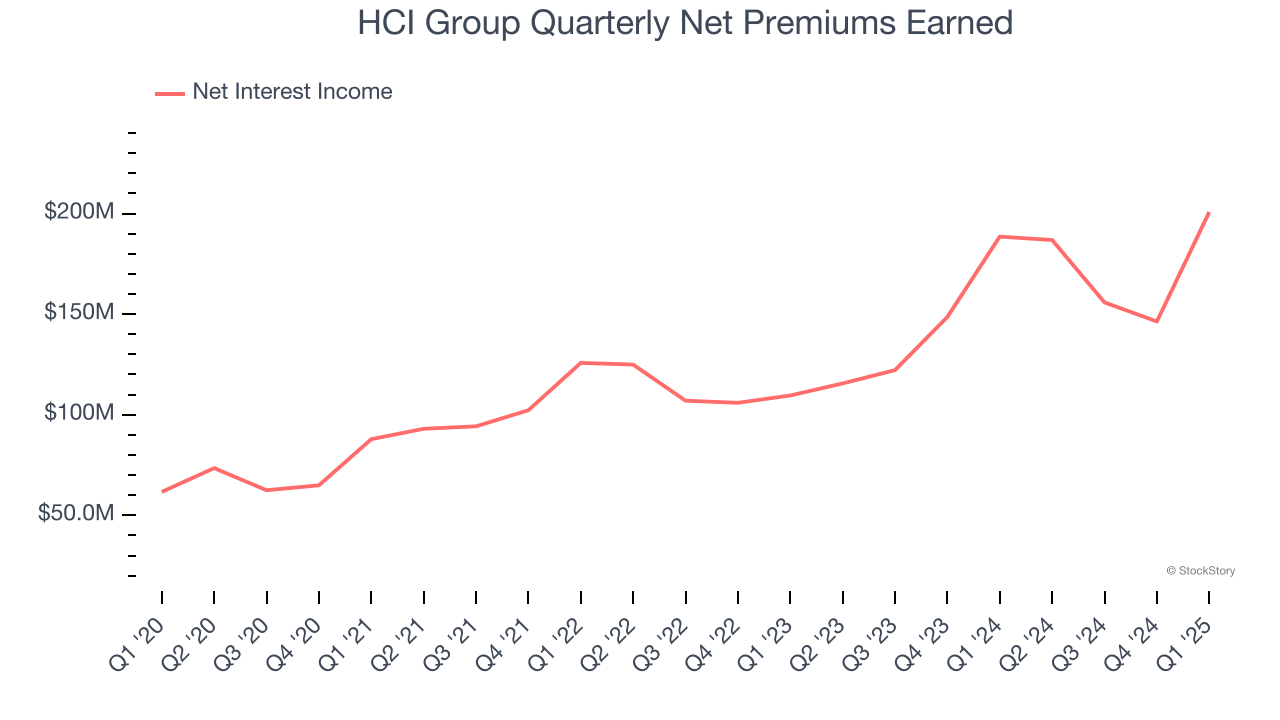
1. Net Premiums Earned Skyrockets, Fueling Growth Opportunities
Markets consistently prioritize net premiums earned growth over investment and fee income, recognizing its superior quality as a core indicator of the company’s underwriting success and market penetration.
HCI Group’s net premiums earned has grown at a 24.2% annualized rate over the last two years, much better than the broader insurance industry and faster than its total revenue.
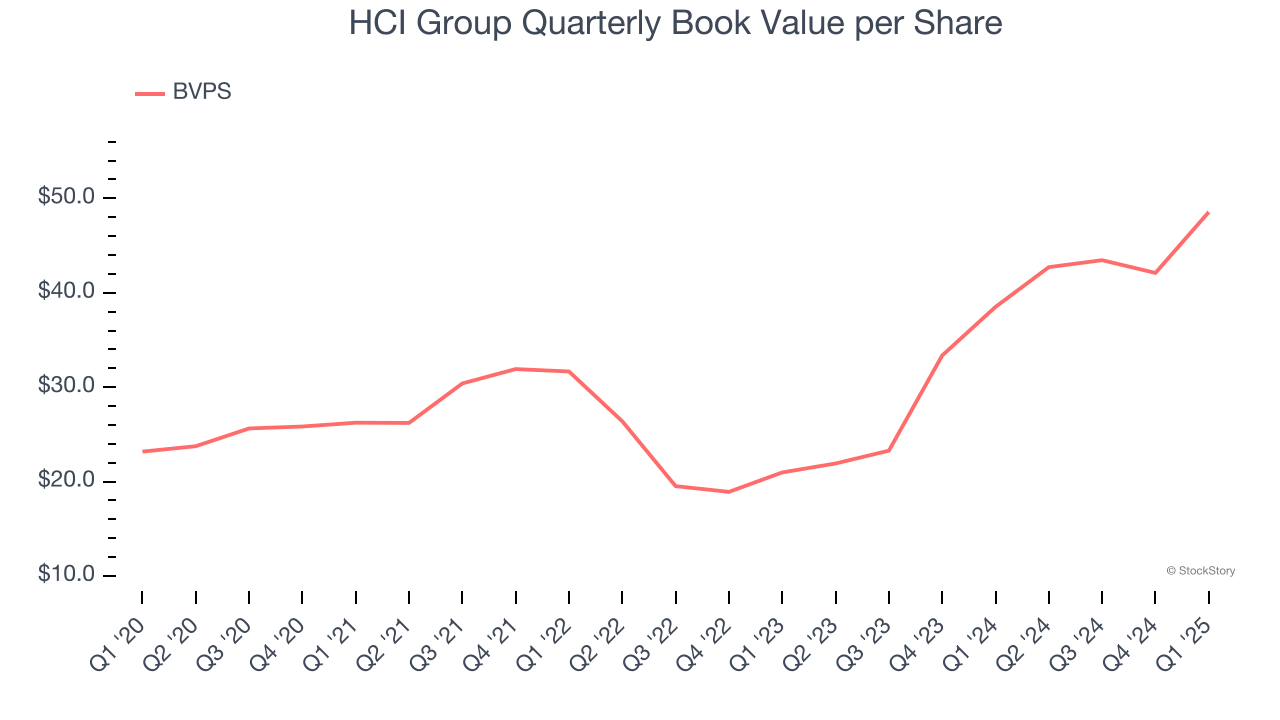
2. Growing BVPS Reflects Strong Asset Base
Book value per share (BVPS) serves as a key indicator of an insurer’s financial stability, reflecting a company’s ability to maintain adequate capital levels and meet its long-term obligations to policyholders.
HCI Group’s BVPS increased by 15.9% annually over the last five years, and growth has recently accelerated as BVPS grew at an incredible 52.2% annual clip over the past two years (from $20.97 to $48.55 per share).

3. Projected BVPS Growth Is Remarkable
Book value per share (BVPS) growth is driven by an insurer’s ability to earn consistent underwriting profits while generating strong investment returns.
Over the next 12 months, Consensus estimates call for HCI Group’s BVPS to grow by 22.2% to $45.95, elite growth rate.
Final Judgment
These are just a few reasons why HCI Group ranks near the top of our list, and with its shares beating the market recently, the stock trades at 2.4× forward P/B (or $138.18 per share). Is now the right time to buy? See for yourself in our in-depth research report, it’s free.
Stocks We Like Even More Than HCI Group
When Trump unveiled his aggressive tariff plan in April 2025, markets tanked as investors feared a full-blown trade war. But those who panicked and sold missed the subsequent rebound that’s already erased most losses.
Don’t let fear keep you from great opportunities and take a look at Top 5 Strong Momentum Stocks for this week. This is a curated list of our High Quality stocks that have generated a market-beating return of 183% over the last five years (as of March 31st 2025).
Stocks that made our list in 2020 include now familiar names such as Nvidia (+1,545% between March 2020 and March 2025) as well as under-the-radar businesses like the once-micro-cap company Kadant (+351% five-year return). Find your next big winner with StockStory today.
StockStory is growing and hiring equity analyst and marketing roles. Are you a 0 to 1 builder passionate about the markets and AI? See the open roles here.