
Restaurant company Cheesecake Factory (NASDAQ: CAKE) reported revenue ahead of Wall Street’s expectations in Q2 CY2025, with sales up 5.7% year on year to $955.8 million. Its non-GAAP profit of $1.16 per share was 9.2% above analysts’ consensus estimates.
Is now the time to buy The Cheesecake Factory? Find out by accessing our full research report, it’s free.
The Cheesecake Factory (CAKE) Q2 CY2025 Highlights:
- Revenue: $955.8 million vs analyst estimates of $948.3 million (5.7% year-on-year growth, 0.8% beat)
- Adjusted EPS: $1.16 vs analyst estimates of $1.06 (9.2% beat)
- Adjusted EBITDA: $91.68 million vs analyst estimates of $86.19 million (9.6% margin, 6.4% beat)
- Operating Margin: 6.8%, in line with the same quarter last year
- Same-Store Sales rose 1.2% year on year, in line with the same quarter last year
- Market Capitalization: $3.26 billion
“We delivered another quarter of strong results, with record-high revenue, continued margin expansion, and profitability that exceeded our guidance,” said David Overton, Chairman and Chief Executive Officer.
Company Overview
Celebrated for its delicious (and free) brown bread, gigantic portions, and delectable desserts, Cheesecake Factory (NASDAQ: CAKE) is an iconic American restaurant chain that also owns and operates a portfolio of separate restaurant brands.
Revenue Growth
Examining a company’s long-term performance can provide clues about its quality. Any business can have short-term success, but a top-tier one grows for years.
With $3.67 billion in revenue over the past 12 months, The Cheesecake Factory is one of the larger restaurant chains in the industry and benefits from a well-known brand that influences consumer purchasing decisions.
As you can see below, The Cheesecake Factory’s 7.6% annualized revenue growth over the last six years (we compare to 2019 to normalize for COVID-19 impacts) was decent as it opened new restaurants and increased sales at existing, established dining locations.
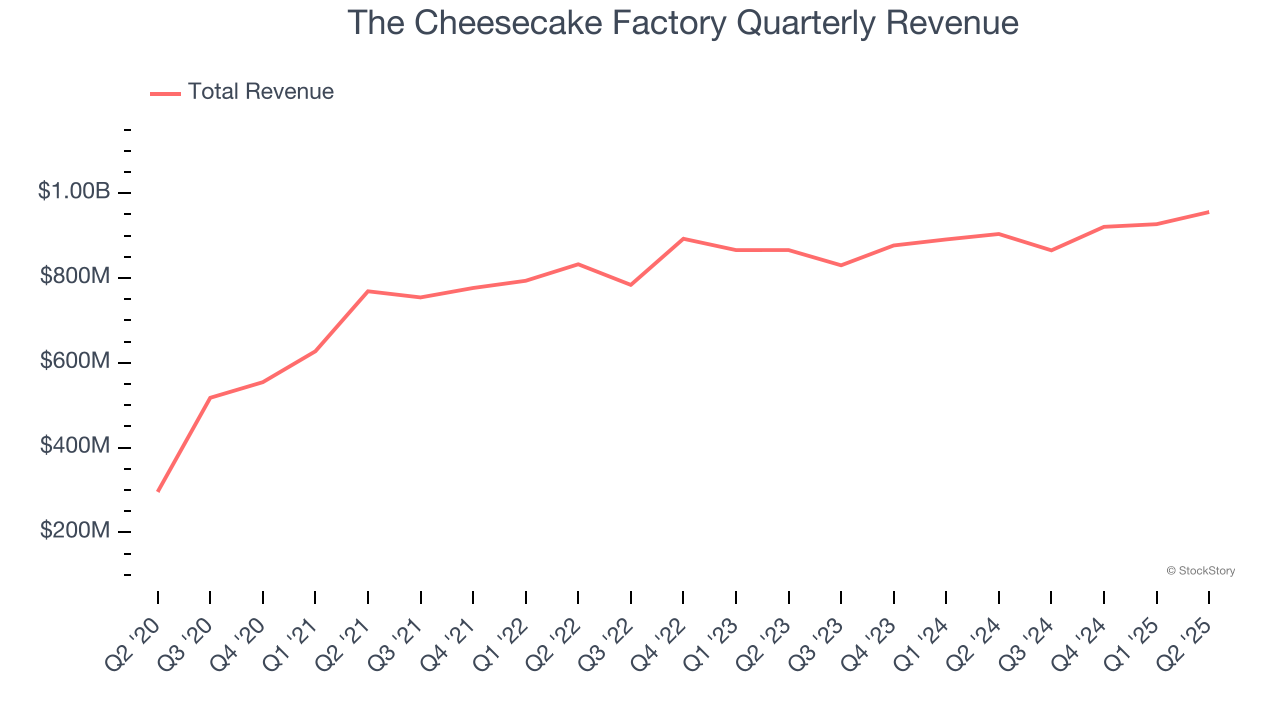
This quarter, The Cheesecake Factory reported year-on-year revenue growth of 5.7%, and its $955.8 million of revenue exceeded Wall Street’s estimates by 0.8%.
Looking ahead, sell-side analysts expect revenue to grow 5.6% over the next 12 months, a slight deceleration versus the last six years. This projection doesn't excite us and indicates its menu offerings will see some demand headwinds.
Software is eating the world and there is virtually no industry left that has been untouched by it. That drives increasing demand for tools helping software developers do their jobs, whether it be monitoring critical cloud infrastructure, integrating audio and video functionality, or ensuring smooth content streaming. Click here to access a free report on our 3 favorite stocks to play this generational megatrend.
Restaurant Performance
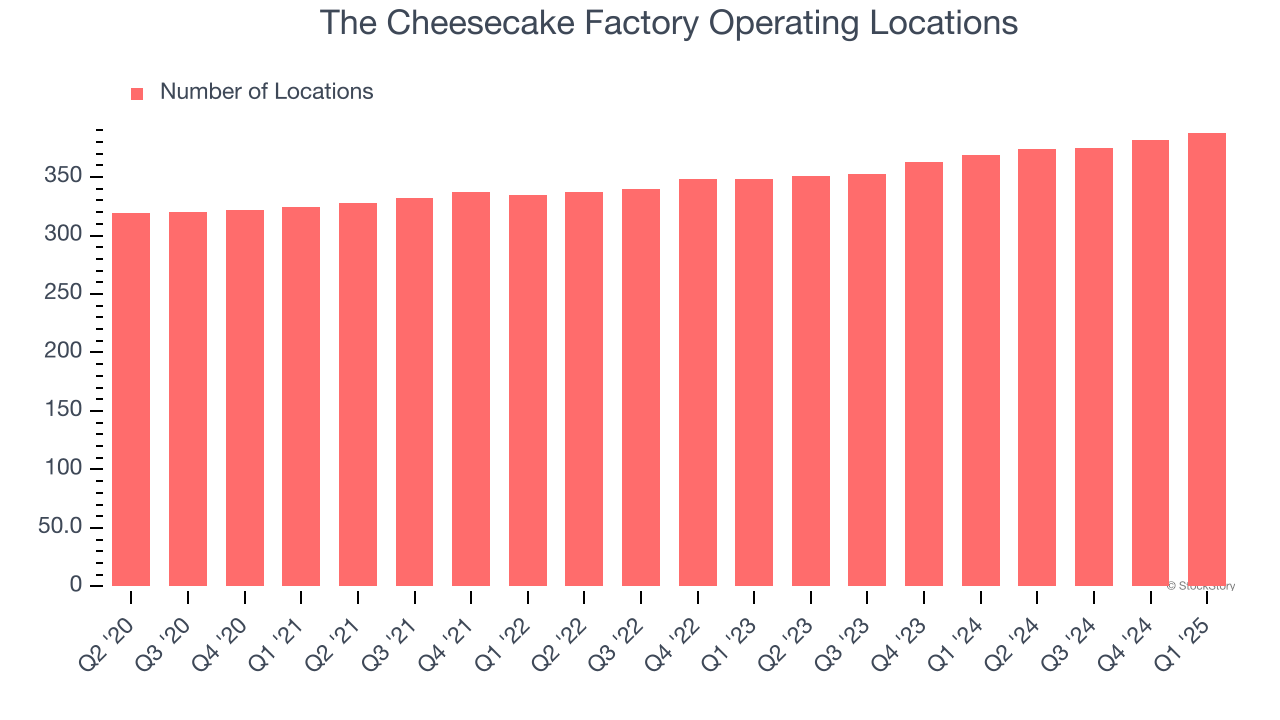
Number of Restaurants
The Cheesecake Factory opened new restaurants at a rapid clip over the last two years, averaging 5.3% annual growth, much faster than the broader restaurant sector.
When a chain opens new restaurants, it usually means it’s investing for growth because there’s healthy demand for its meals and there are markets where its concepts have few or no locations.
Note that The Cheesecake Factory reports its restaurant count intermittently, so some data points are missing in the chart below.
Same-Store Sales
The change in a company's restaurant base only tells one side of the story. The other is the performance of its existing locations, which informs management teams whether they should expand or downsize their physical footprints. Same-store sales gives us insight into this topic because it measures organic growth at restaurants open for at least a year.
The Cheesecake Factory’s demand within its existing dining locations has been relatively stable over the last two years but was below most restaurant chains. On average, the company’s same-store sales have grown by 1.5% per year. This performance suggests it should consider improving its foot traffic and efficiency before expanding its restaurant base.
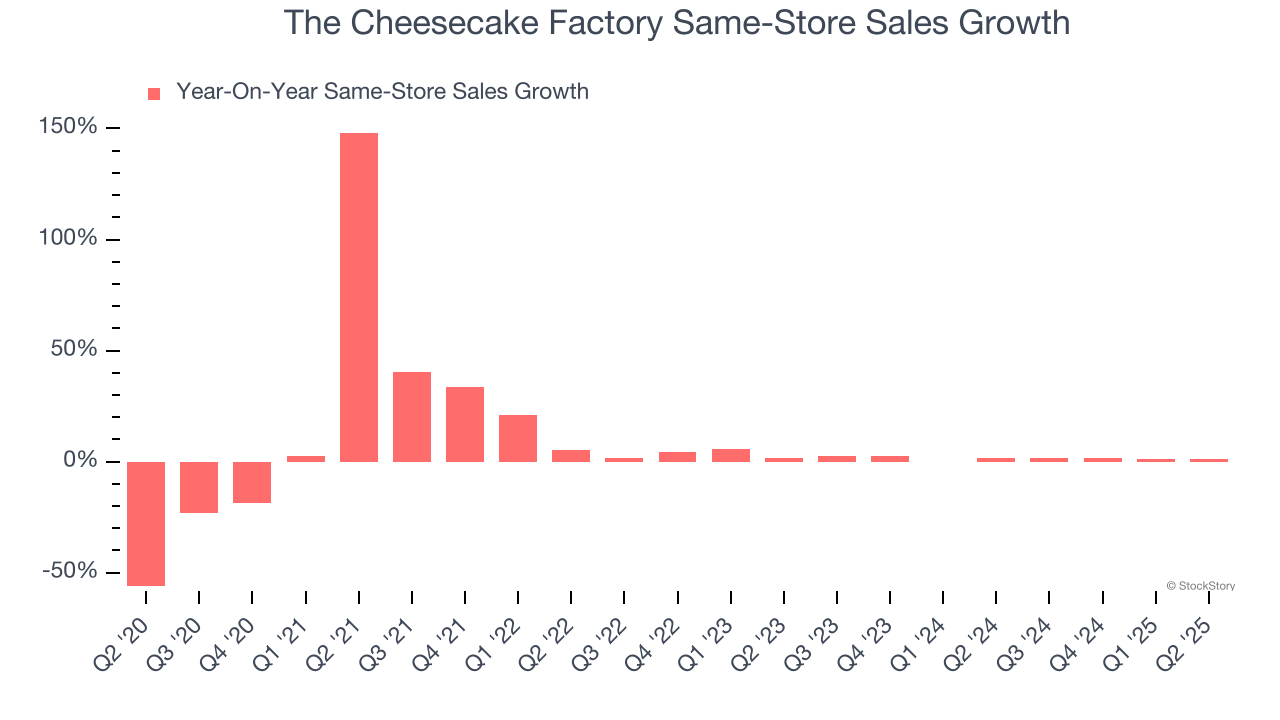
In the latest quarter, The Cheesecake Factory’s same-store sales rose 1.2% year on year. This performance was more or less in line with its historical levels.
Key Takeaways from The Cheesecake Factory’s Q2 Results
We enjoyed seeing The Cheesecake Factory beat analysts’ EBITDA expectations this quarter. We were also happy its revenue narrowly outperformed Wall Street’s estimates. Overall, we think this was a solid quarter with some key areas of upside. The stock traded up 3.5% to $65.32 immediately following the results.
Sure, The Cheesecake Factory had a solid quarter, but if we look at the bigger picture, is this stock a buy? The latest quarter does matter, but not nearly as much as longer-term fundamentals and valuation, when deciding if the stock is a buy. We cover that in our actionable full research report which you can read here, it’s free.


