
Financial services provider CBIZ (NYSE: CBZ) fell short of the market’s revenue expectations in Q2 CY2025, but sales rose 62.7% year on year to $683.5 million. On the other hand, the company’s full-year revenue guidance of $2.88 billion at the midpoint came in 0.9% above analysts’ estimates. Its non-GAAP profit of $0.95 per share was 12.6% above analysts’ consensus estimates.
Is now the time to buy CBIZ? Find out by accessing our full research report, it’s free.
CBIZ (CBZ) Q2 CY2025 Highlights:
- Revenue: $683.5 million vs analyst estimates of $701.4 million (62.7% year-on-year growth, 2.6% miss)
- Adjusted EPS: $0.95 vs analyst estimates of $0.84 (12.6% beat)
- Adjusted EBITDA: $117.2 million vs analyst estimates of $108.9 million (17.1% margin, 7.6% beat)
- The company reconfirmed its revenue guidance for the full year of $2.88 billion at the midpoint
- Management reiterated its full-year Adjusted EPS guidance of $3.63 at the midpoint
- EBITDA guidance for the full year is $453 million at the midpoint, in line with analyst expectations
- Operating Margin: 8.8%, up from 7.6% in the same quarter last year
- Market Capitalization: $4.05 billion
“We’re pleased to deliver strong earnings in the second quarter and year-to-date demonstrating the strength and resilience of our business model amidst challenging market conditions,” said Jerry Grisko, CBIZ President and CEO.
Company Overview
With over 120 offices across 33 states and a team of more than 6,700 professionals, CBIZ (NYSE: CBZ) provides accounting, tax, benefits, insurance brokerage, and advisory services to help small and mid-sized businesses manage their finances and operations.
Revenue Growth
A company’s long-term sales performance can indicate its overall quality. Even a bad business can shine for one or two quarters, but a top-tier one grows for years.
With $2.42 billion in revenue over the past 12 months, CBIZ is a mid-sized business services company, which sometimes brings disadvantages compared to larger competitors benefiting from better economies of scale. On the bright side, it can still flex high growth rates because it’s working from a smaller revenue base.
As you can see below, CBIZ’s 22.5% annualized revenue growth over the last five years was incredible. This shows it had high demand, a useful starting point for our analysis.
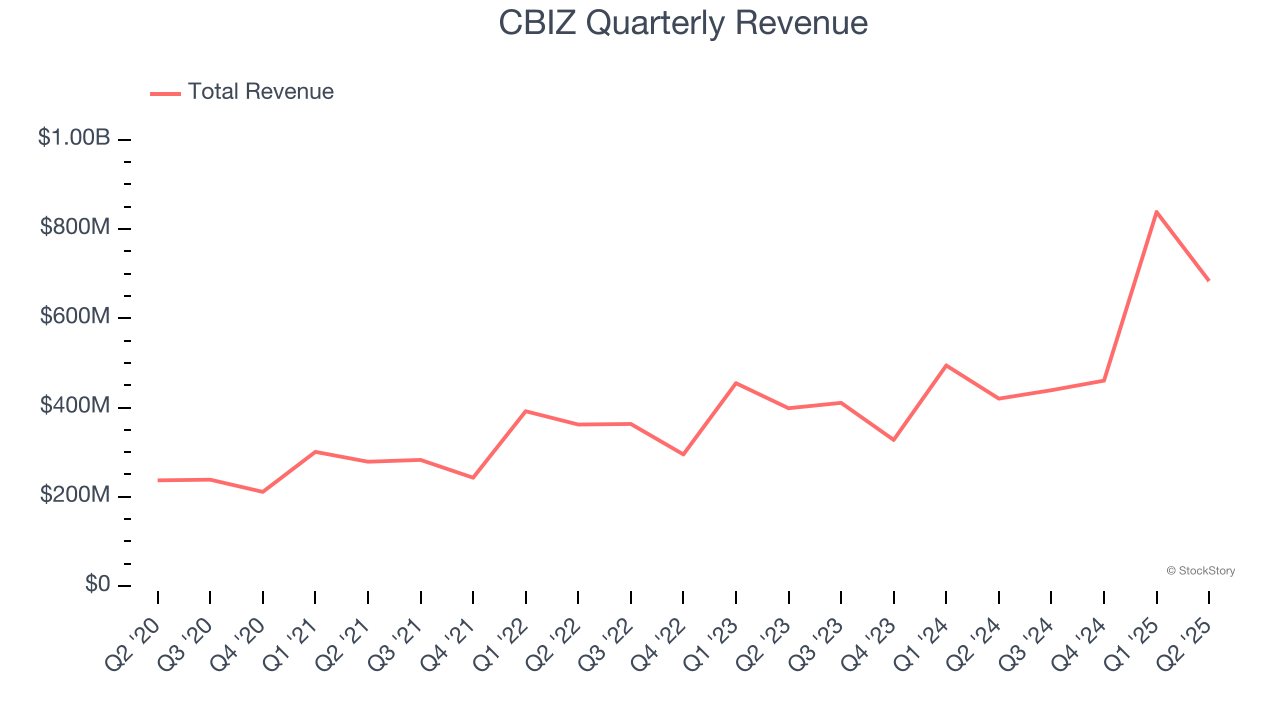
Long-term growth is the most important, but within business services, a half-decade historical view may miss new innovations or demand cycles. CBIZ’s annualized revenue growth of 26.6% over the last two years is above its five-year trend, suggesting its demand was strong and recently accelerated. 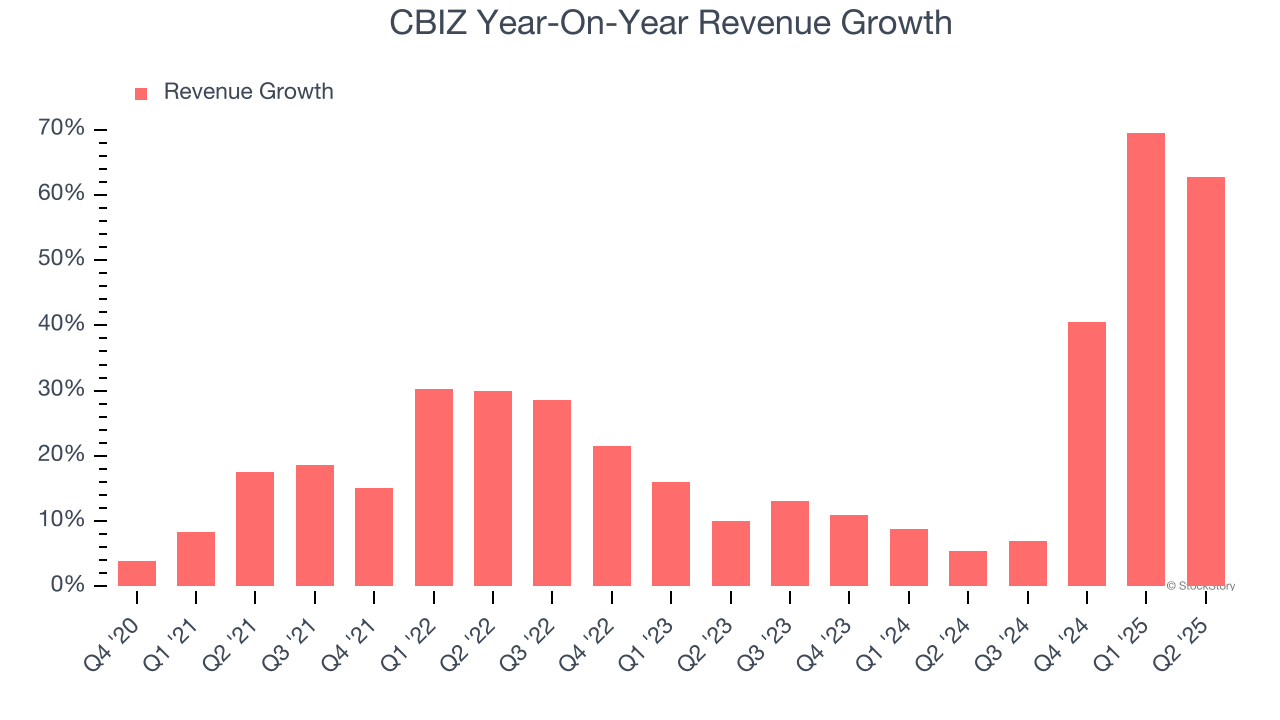
This quarter, CBIZ achieved a magnificent 62.7% year-on-year revenue growth rate, but its $683.5 million of revenue fell short of Wall Street’s lofty estimates.
Looking ahead, sell-side analysts expect revenue to grow 45.6% over the next 12 months, an improvement versus the last two years. This projection is eye-popping and suggests its newer products and services will spur better top-line performance.
Here at StockStory, we certainly understand the potential of thematic investing. Diverse winners from Microsoft (MSFT) to Alphabet (GOOG), Coca-Cola (KO) to Monster Beverage (MNST) could all have been identified as promising growth stories with a megatrend driving the growth. So, in that spirit, we’ve identified a relatively under-the-radar profitable growth stock benefiting from the rise of AI, available to you FREE via this link.
Operating Margin
Operating margin is an important measure of profitability as it shows the portion of revenue left after accounting for all core expenses – everything from the cost of goods sold to advertising and wages. It’s also useful for comparing profitability across companies with different levels of debt and tax rates because it excludes interest and taxes.
CBIZ has done a decent job managing its cost base over the last five years. The company has produced an average operating margin of 10.9%, higher than the broader business services sector.
Looking at the trend in its profitability, CBIZ’s operating margin rose by 1.3 percentage points over the last five years, as its sales growth gave it operating leverage.
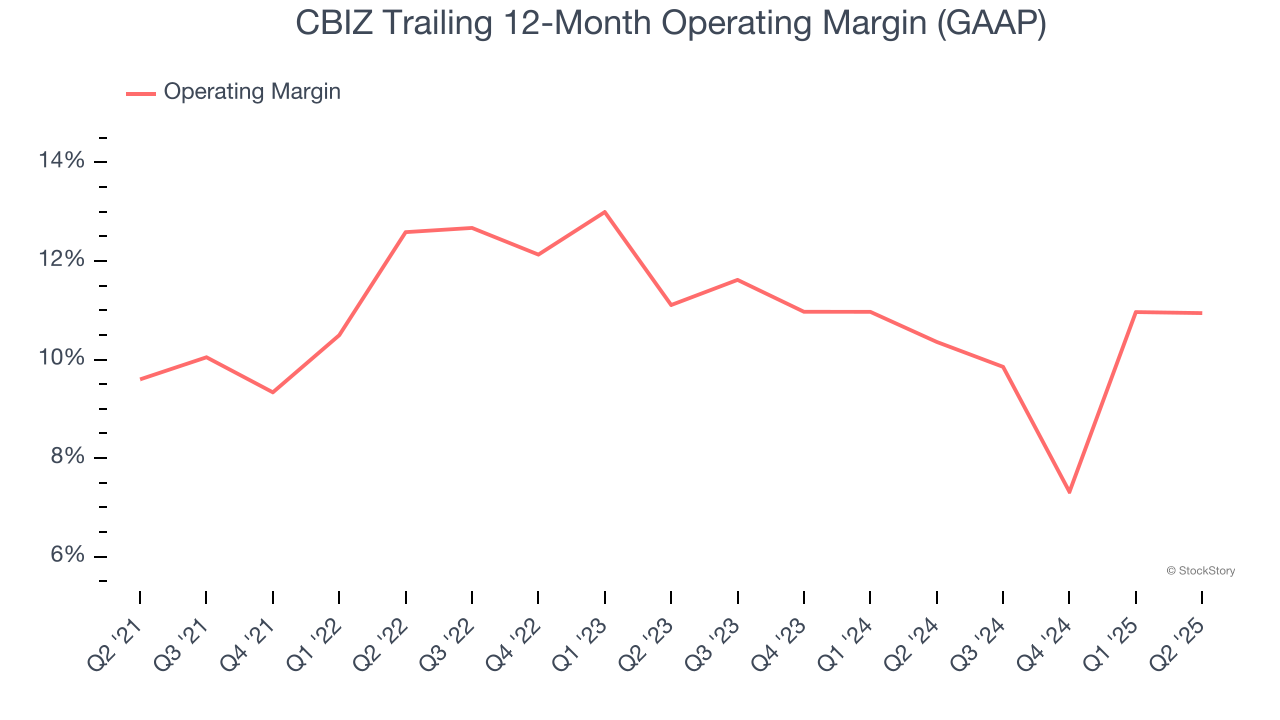
In Q2, CBIZ generated an operating margin profit margin of 8.8%, up 1.2 percentage points year on year. This increase was a welcome development and shows it was more efficient.
Earnings Per Share
Revenue trends explain a company’s historical growth, but the long-term change in earnings per share (EPS) points to the profitability of that growth – for example, a company could inflate its sales through excessive spending on advertising and promotions.
CBIZ’s astounding 23.5% annual EPS growth over the last five years aligns with its revenue performance. This tells us its incremental sales were profitable.
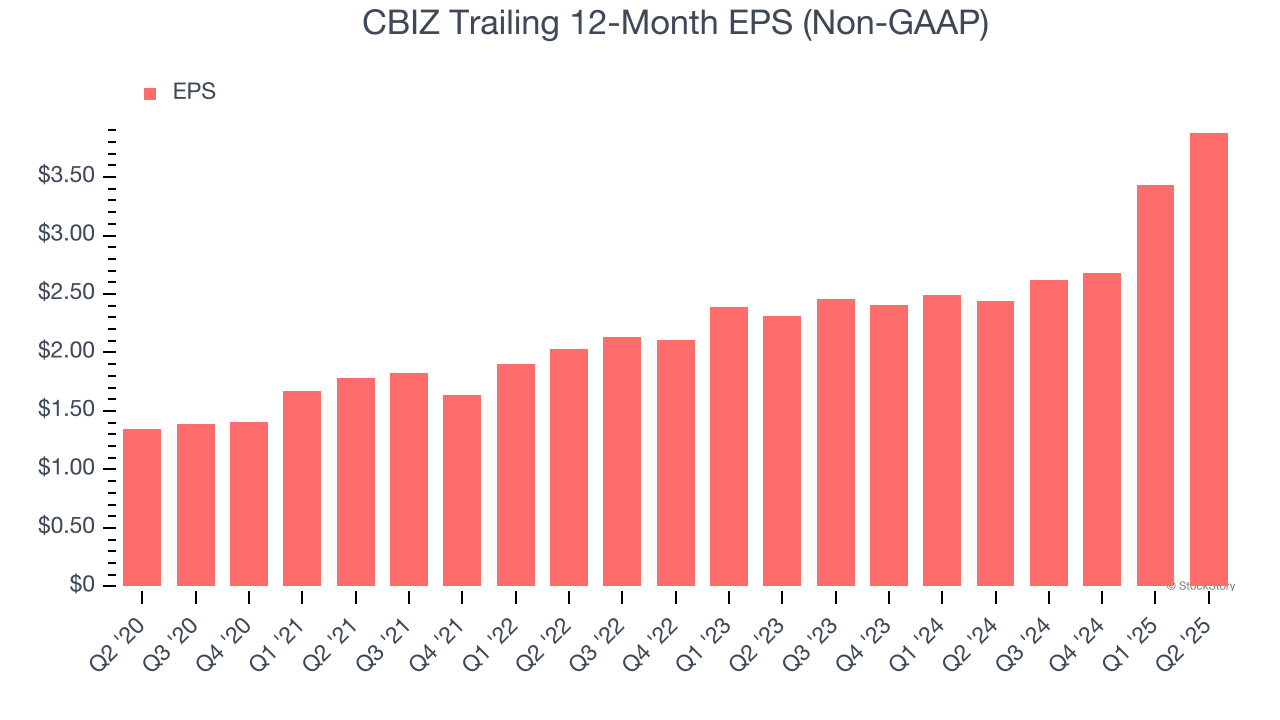
Like with revenue, we analyze EPS over a more recent period because it can provide insight into an emerging theme or development for the business.
For CBIZ, its two-year annual EPS growth of 29.6% was higher than its five-year trend. We love it when earnings growth accelerates, especially when it accelerates off an already high base.
In Q2, CBIZ reported adjusted EPS at $0.95, up from $0.50 in the same quarter last year. This print easily cleared analysts’ estimates, and shareholders should be content with the results. Over the next 12 months, Wall Street expects CBIZ’s full-year EPS of $3.88 to stay about the same.
Key Takeaways from CBIZ’s Q2 Results
We enjoyed seeing CBIZ beat analysts’ EPS and EBITDA expectations this quarter. We were also happy its full-year EPS guidance narrowly outperformed Wall Street’s estimates. On the other hand, its revenue missed. Overall, this print had some key positives. The stock remained flat at $76.15 immediately following the results.
Should you buy the stock or not? When making that decision, it’s important to consider its valuation, business qualities, as well as what has happened in the latest quarter. We cover that in our actionable full research report which you can read here, it’s free.