
Alternate site health provider Option Care Health (NASDAQ: OPCH) reported Q2 CY2025 results beating Wall Street’s revenue expectations, with sales up 15.4% year on year to $1.42 billion. The company expects the full year’s revenue to be around $5.58 billion, close to analysts’ estimates. Its non-GAAP profit of $0.41 per share was 3.3% above analysts’ consensus estimates.
Is now the time to buy Option Care Health? Find out by accessing our full research report, it’s free.
Option Care Health (OPCH) Q2 CY2025 Highlights:
- Revenue: $1.42 billion vs analyst estimates of $1.35 billion (15.4% year-on-year growth, 4.6% beat)
- Adjusted EPS: $0.41 vs analyst estimates of $0.40 (3.3% beat)
- Adjusted EBITDA: $114 million vs analyst estimates of $110.8 million (8.1% margin, 2.9% beat)
- The company lifted its revenue guidance for the full year to $5.58 billion at the midpoint from $5.5 billion, a 1.4% increase
- Management raised its full-year Adjusted EPS guidance to $1.69 at the midpoint, a 1.8% increase
- EBITDA guidance for the full year is $470 million at the midpoint, above analyst estimates of $464.7 million
- Operating Margin: 5.8%, in line with the same quarter last year
- Free Cash Flow Margin: 5.7%, down from 15.1% in the same quarter last year
- Market Capitalization: $4.93 billion
John C. Rademacher, Chief Executive Officer, commented, “I am proud of the second quarter performance and the Option Care Health team's ability to show resilience in a dynamic marketplace. We continue to execute on opportunities to provide strong clinical outcomes while helping reduce the total cost of care.”
Company Overview
With a nationwide network of 177 locations serving 43 states and a team of over 4,500 clinicians, Option Care Health (NASDAQ: OPCH) is the largest independent provider of home and alternate site infusion services, delivering medications and clinical support to patients across the United States.
Revenue Growth
A company’s long-term sales performance is one signal of its overall quality. Any business can put up a good quarter or two, but many enduring ones grow for years. Luckily, Option Care Health’s sales grew at a solid 14.1% compounded annual growth rate over the last five years. Its growth beat the average healthcare company and shows its offerings resonate with customers.
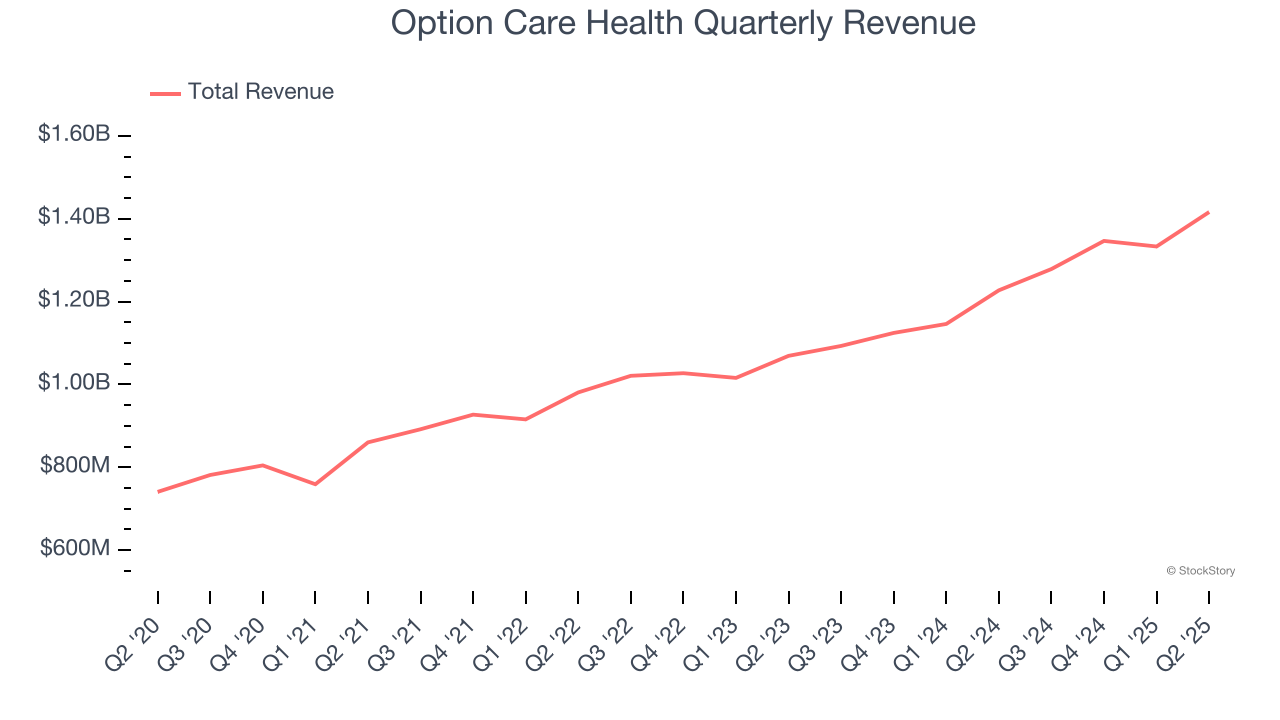
We at StockStory place the most emphasis on long-term growth, but within healthcare, a half-decade historical view may miss recent innovations or disruptive industry trends. Option Care Health’s annualized revenue growth of 14% over the last two years aligns with its five-year trend, suggesting its demand was predictably strong. 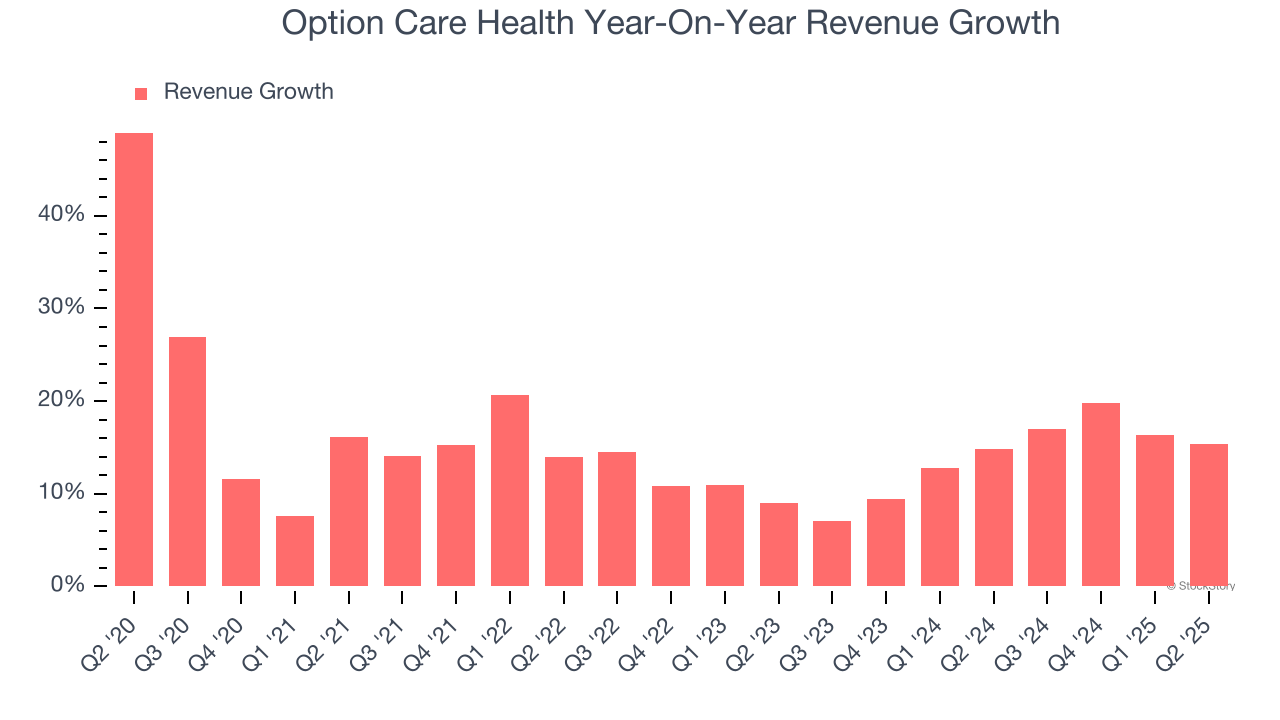
This quarter, Option Care Health reported year-on-year revenue growth of 15.4%, and its $1.42 billion of revenue exceeded Wall Street’s estimates by 4.6%.
Looking ahead, sell-side analysts expect revenue to grow 7.6% over the next 12 months, a deceleration versus the last two years. Still, this projection is above the sector average and indicates the market sees some success for its newer products and services.
Unless you’ve been living under a rock, it should be obvious by now that generative AI is going to have a huge impact on how large corporations do business. While Nvidia and AMD are trading close to all-time highs, we prefer a lesser-known (but still profitable) stock benefiting from the rise of AI. Click here to access our free report one of our favorites growth stories.
Operating Margin
Option Care Health was profitable over the last five years but held back by its large cost base. Its average operating margin of 6.2% was weak for a healthcare business.
On the plus side, Option Care Health’s operating margin rose by 1.3 percentage points over the last five years, as its sales growth gave it operating leverage.
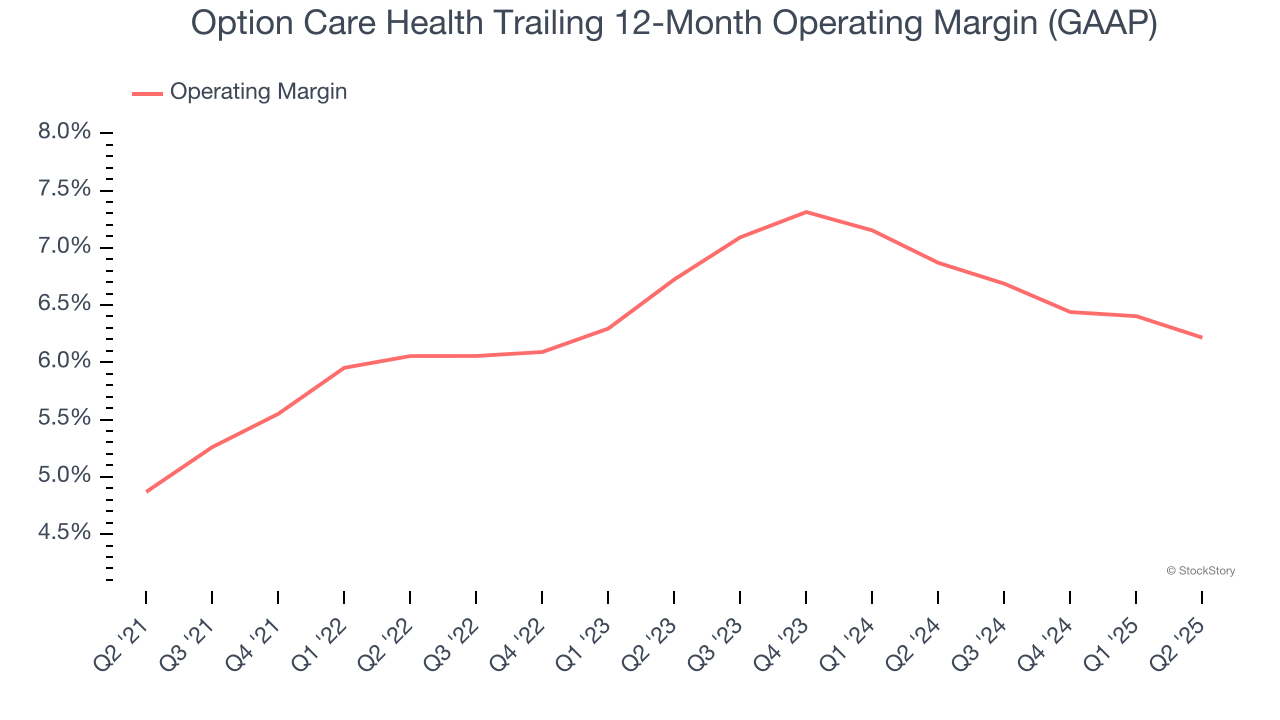
In Q2, Option Care Health generated an operating margin profit margin of 5.8%, in line with the same quarter last year. This indicates the company’s overall cost structure has been relatively stable.
Earnings Per Share
We track the long-term change in earnings per share (EPS) for the same reason as long-term revenue growth. Compared to revenue, however, EPS highlights whether a company’s growth is profitable.
Option Care Health’s full-year EPS flipped from negative to positive over the last five years. This is encouraging and shows it’s at a critical moment in its life.
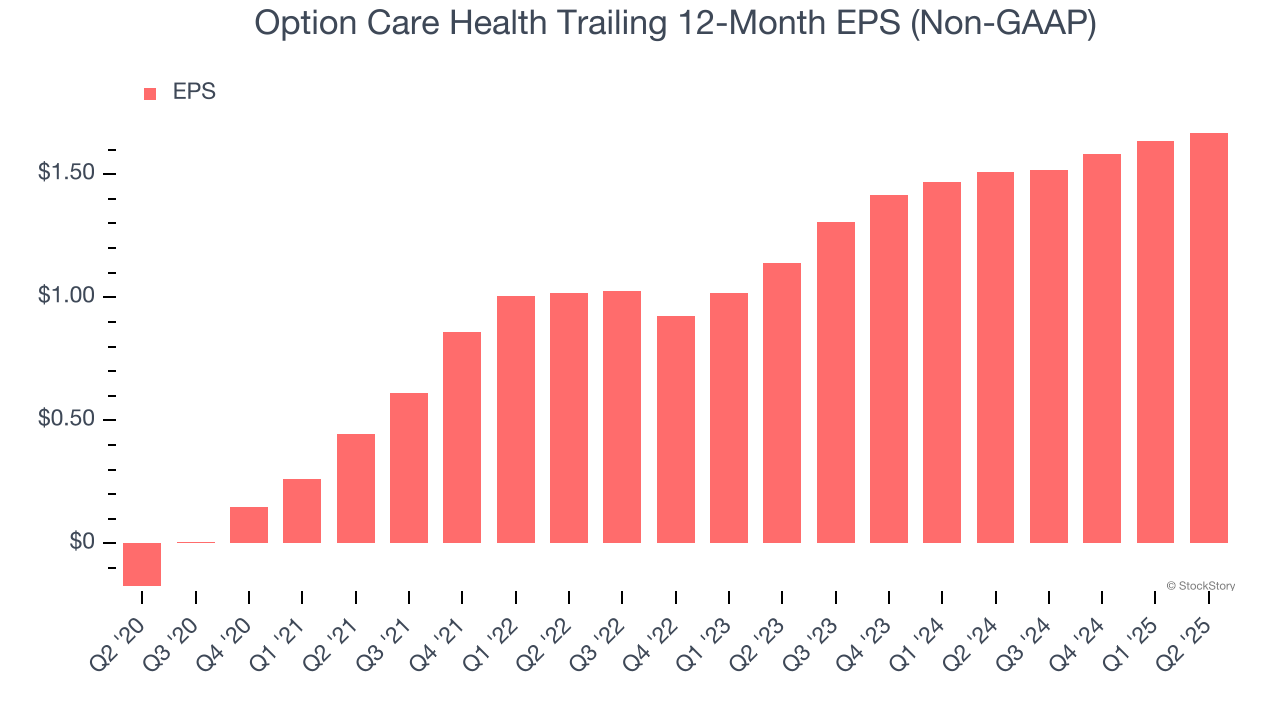
In Q2, Option Care Health reported EPS at $0.41, up from $0.37 in the same quarter last year. This print beat analysts’ estimates by 3.3%. Over the next 12 months, Wall Street expects Option Care Health’s full-year EPS of $1.67 to grow 6.9%.
Key Takeaways from Option Care Health’s Q2 Results
We enjoyed seeing Option Care Health beat analysts’ revenue and EPS expectations this quarter. We were also glad its full-year revenue and EPS guidance were both raised. Overall, this print had some key positives. The stock remained flat at $30.15 immediately following the results.
Is Option Care Health an attractive investment opportunity right now? The latest quarter does matter, but not nearly as much as longer-term fundamentals and valuation, when deciding if the stock is a buy. We cover that in our actionable full research report which you can read here, it’s free.