Funeral services company Service International (NYSE: SCI) reported Q2 CY2025 results topping the market’s revenue expectations, with sales up 3% year on year to $1.07 billion. Its non-GAAP profit of $0.88 per share was 3.6% above analysts’ consensus estimates.
Is now the time to buy Service International? Find out by accessing our full research report, it’s free.
Service International (SCI) Q2 CY2025 Highlights:
- Revenue: $1.07 billion vs analyst estimates of $1.05 billion (3% year-on-year growth, 1.3% beat)
- Adjusted EPS: $0.88 vs analyst estimates of $0.85 (3.6% beat)
- Management reiterated its full-year Adjusted EPS guidance of $3.85 at the midpoint
- Operating Margin: 21.1%, in line with the same quarter last year
- Free Cash Flow Margin: 7.8%, down from 9.7% in the same quarter last year
- Funeral Services Performed: 87,014, up 983 year on year
- Market Capitalization: $10.83 billion
Company Overview
Founded in 1962, Service International (NYSE: SCI) is a leading provider of death care products and services in North America.
Revenue Growth
Reviewing a company’s long-term sales performance reveals insights into its quality. Any business can have short-term success, but a top-tier one grows for years. Over the last five years, Service International grew its sales at a sluggish 5.5% compounded annual growth rate. This was below our standard for the consumer discretionary sector and is a rough starting point for our analysis.
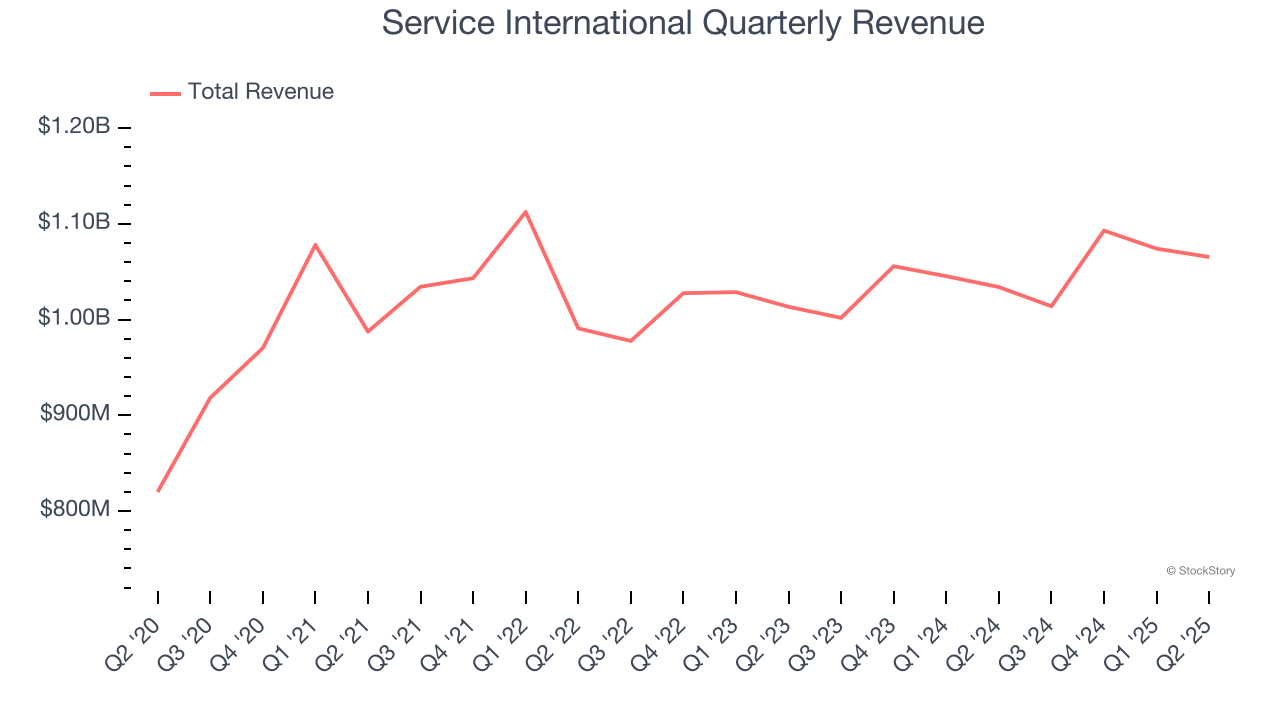
We at StockStory place the most emphasis on long-term growth, but within consumer discretionary, a stretched historical view may miss a company riding a successful new product or trend. Service International’s recent performance shows its demand has slowed as its annualized revenue growth of 2.4% over the last two years was below its five-year trend. 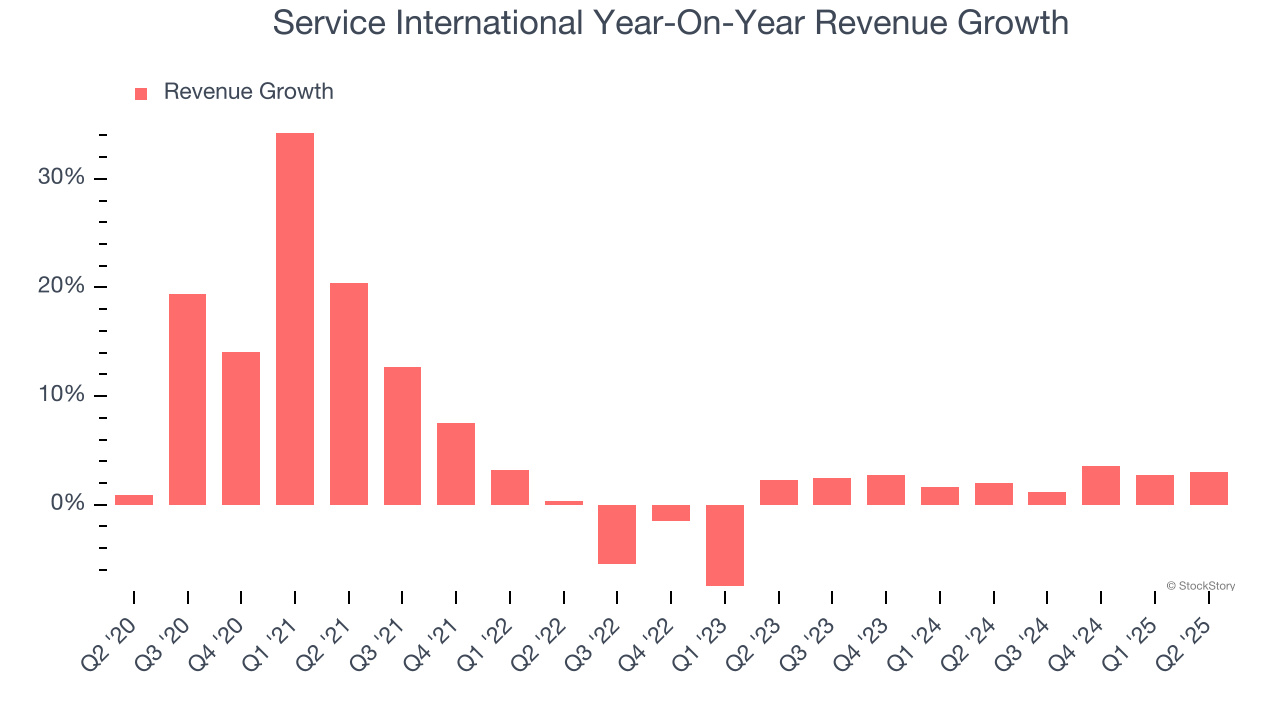
We can dig further into the company’s revenue dynamics by analyzing its number of funeral services performed, which reached 87,014 in the latest quarter. Over the last two years, Service International’s funeral services performed were flat. Because this number is lower than its revenue growth during the same period, we can see the company’s monetization has risen. 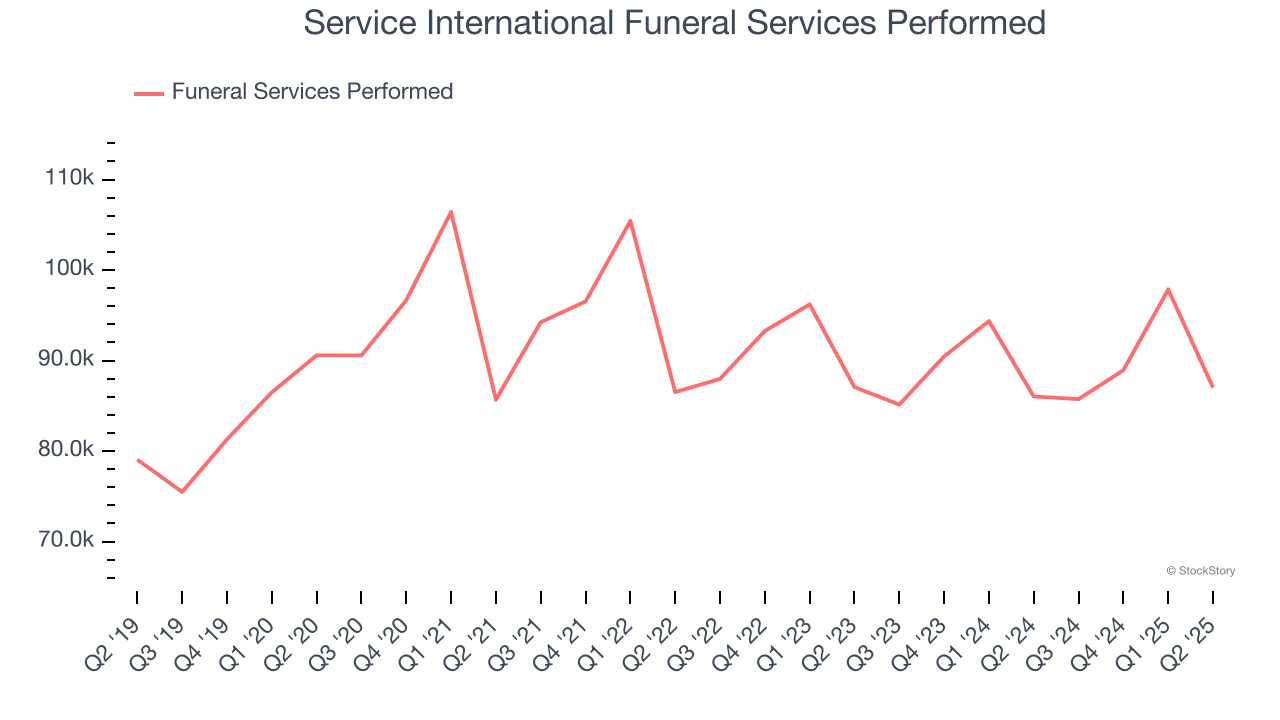
This quarter, Service International reported modest year-on-year revenue growth of 3% but beat Wall Street’s estimates by 1.3%.
Looking ahead, sell-side analysts expect revenue to grow 2.7% over the next 12 months, similar to its two-year rate. This projection doesn't excite us and indicates its newer products and services will not catalyze better top-line performance yet.
Here at StockStory, we certainly understand the potential of thematic investing. Diverse winners from Microsoft (MSFT) to Alphabet (GOOG), Coca-Cola (KO) to Monster Beverage (MNST) could all have been identified as promising growth stories with a megatrend driving the growth. So, in that spirit, we’ve identified a relatively under-the-radar profitable growth stock benefiting from the rise of AI, available to you FREE via this link.
Operating Margin
Service International’s operating margin might fluctuated slightly over the last 12 months but has remained more or less the same, averaging 22.3% over the last two years. This profitability was elite for a consumer discretionary business thanks to its efficient cost structure and economies of scale.
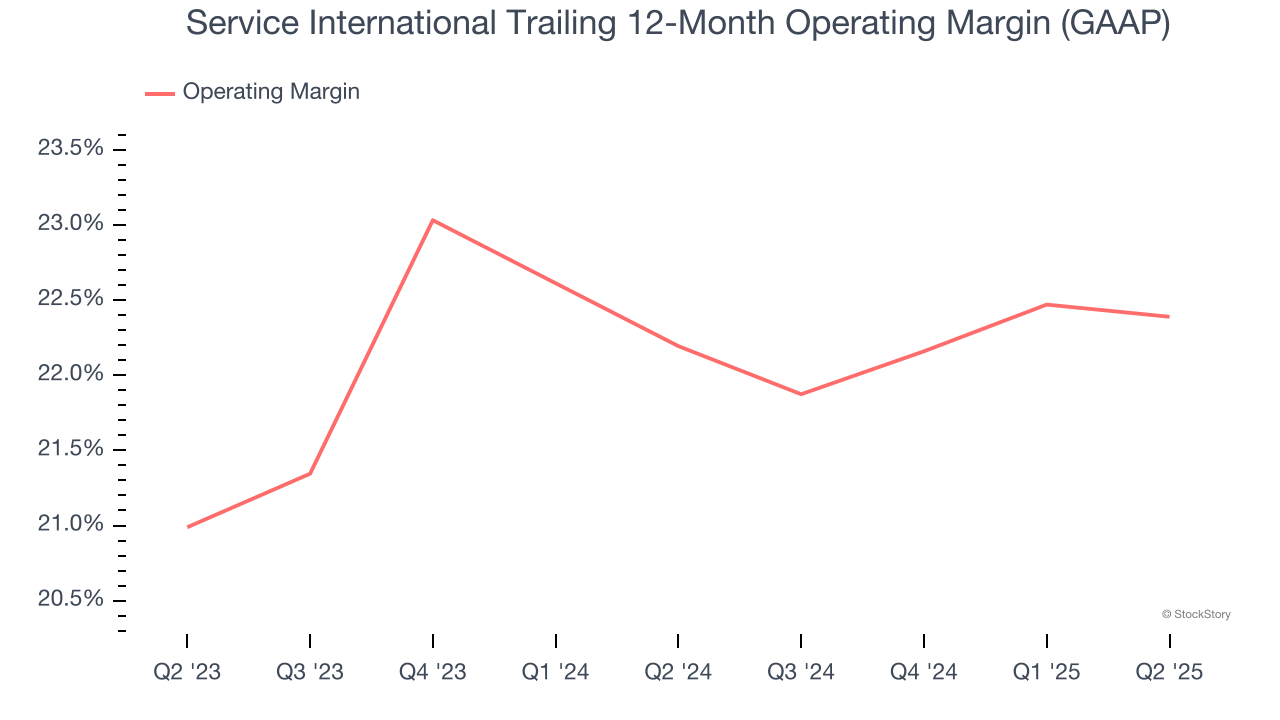
This quarter, Service International generated an operating margin profit margin of 21.1%, in line with the same quarter last year. This indicates the company’s overall cost structure has been relatively stable.
Earnings Per Share
We track the long-term change in earnings per share (EPS) for the same reason as long-term revenue growth. Compared to revenue, however, EPS highlights whether a company’s growth is profitable.
Service International’s EPS grew at a solid 13.3% compounded annual growth rate over the last five years, higher than its 5.5% annualized revenue growth. However, this alone doesn’t tell us much about its business quality because its operating margin didn’t improve.
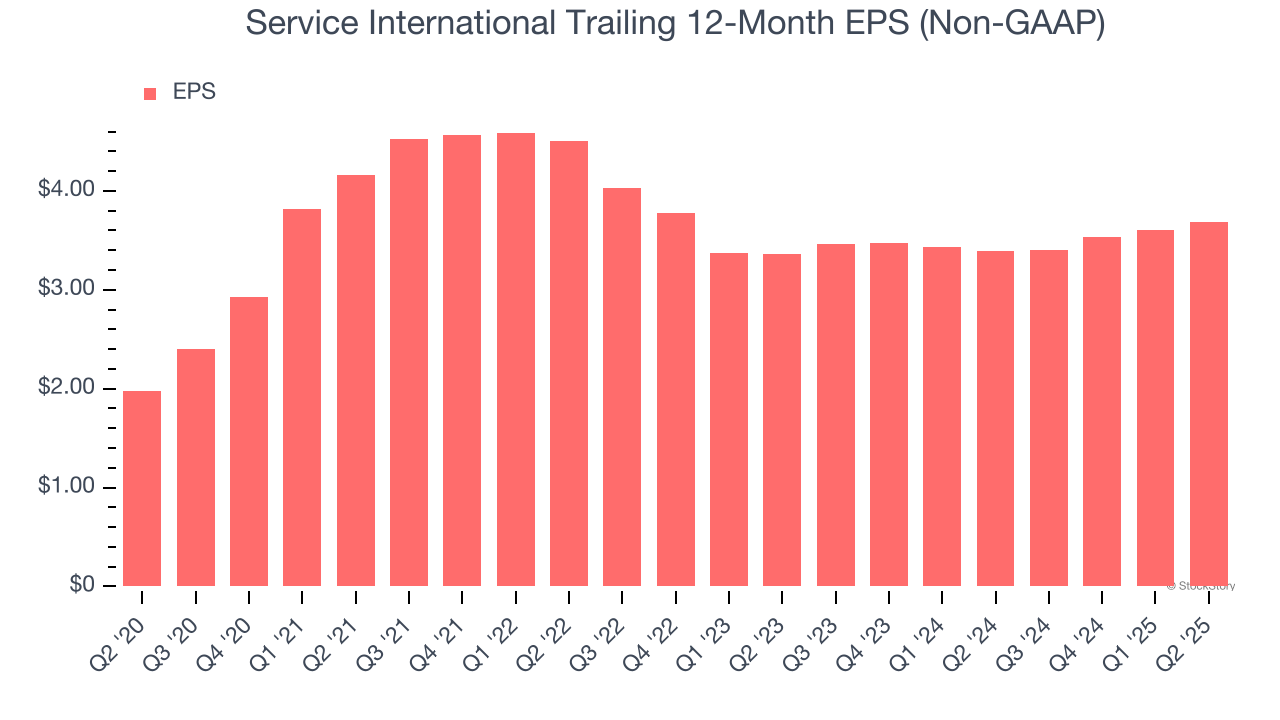
In Q2, Service International reported adjusted EPS at $0.88, up from $0.79 in the same quarter last year. This print beat analysts’ estimates by 3.6%. Over the next 12 months, Wall Street expects Service International’s full-year EPS of $3.69 to grow 7%.
Key Takeaways from Service International’s Q2 Results
It was encouraging to see Service International’s full-year EPS guidance beat analysts’ expectations. We were also happy its revenue narrowly outperformed Wall Street’s estimates. Overall, this was a solid quarter. The stock traded up 1% to $76.38 immediately following the results.
Is Service International an attractive investment opportunity at the current price? We think that the latest quarter is only one piece of the longer-term business quality puzzle. Quality, when combined with valuation, can help determine if the stock is a buy. We cover that in our actionable full research report which you can read here, it’s free.