
Professional services firm Huron Consulting Group (NASDAQ: HURN) fell short of the market’s revenue expectations in Q2 CY2025, but sales rose 8.1% year on year to $411.8 million. On the other hand, the company’s full-year revenue guidance of $1.66 billion at the midpoint came in 2.2% above analysts’ estimates. Its non-GAAP profit of $1.89 per share was 5.4% above analysts’ consensus estimates.
Is now the time to buy Huron? Find out by accessing our full research report, it’s free.
Huron (HURN) Q2 CY2025 Highlights:
- Revenue: $411.8 million vs analyst estimates of $414.2 million (8.1% year-on-year growth, 0.6% miss)
- Adjusted EPS: $1.89 vs analyst estimates of $1.79 (5.4% beat)
- Adjusted EBITDA: $60.58 million vs analyst estimates of $61.53 million (14.7% margin, 1.5% miss)
- The company lifted its revenue guidance for the full year to $1.66 billion at the midpoint from $1.62 billion, a 2.5% increase
- Management raised its full-year Adjusted EPS guidance to $7.50 at the midpoint, a 4.2% increase
- Operating Margin: 11.1%, down from 15.6% in the same quarter last year
- Free Cash Flow Margin: 20.6%, down from 25.8% in the same quarter last year
- Market Capitalization: $2.11 billion
“Revenues before reimbursable expenses (RBR) in the quarter grew 8% compared to the second quarter of 2024, including organic RBR growth across all three operating segments,” said Mark Hussey, chief executive officer and president of Huron.
Company Overview
Founded in 2002 during a time of significant regulatory change in corporate America, Huron Consulting Group (NASDAQ: HURN) is a professional services company that helps organizations develop growth strategies, optimize operations, and implement digital transformation solutions.
Revenue Growth
A company’s long-term performance is an indicator of its overall quality. Any business can have short-term success, but a top-tier one grows for years.
With $1.59 billion in revenue over the past 12 months, Huron is a small player in the business services space, which sometimes brings disadvantages compared to larger competitors benefiting from economies of scale and numerous distribution channels. On the bright side, it can grow faster because it has more room to expand.
As you can see below, Huron’s 10.6% annualized revenue growth over the last five years was impressive. This is an encouraging starting point for our analysis because it shows Huron’s demand was higher than many business services companies.
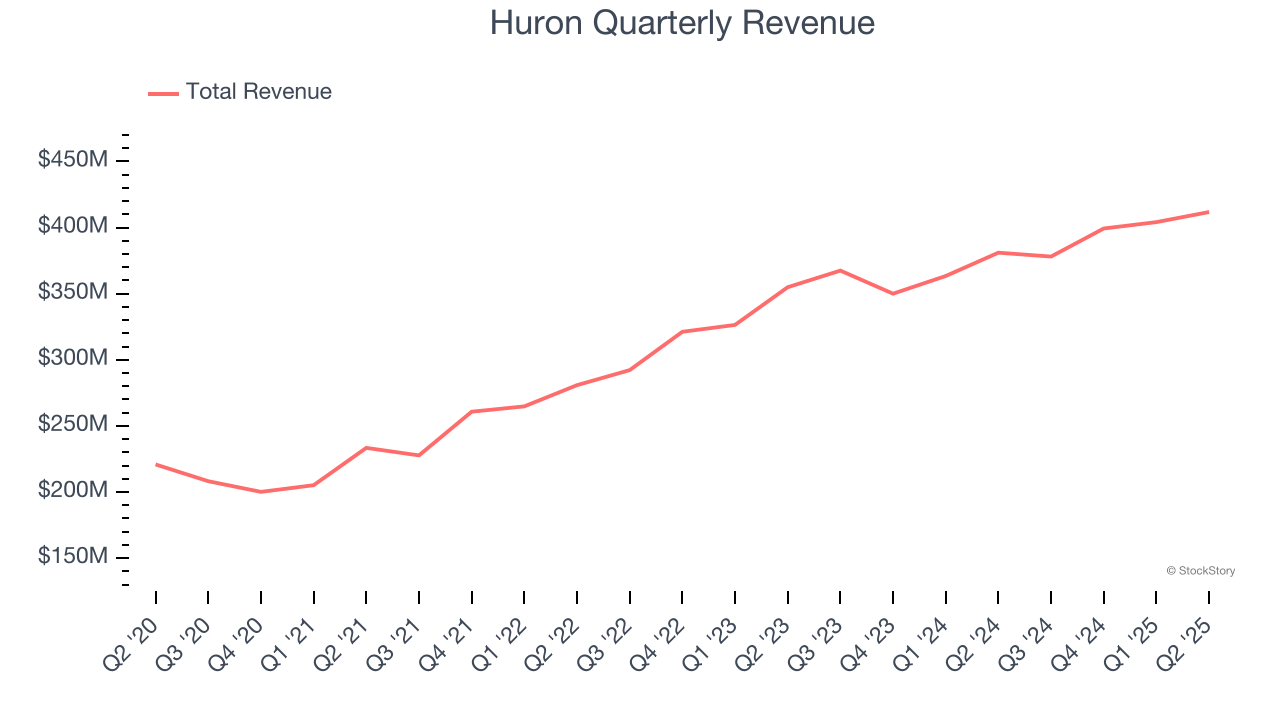
We at StockStory place the most emphasis on long-term growth, but within business services, a half-decade historical view may miss recent innovations or disruptive industry trends. Huron’s annualized revenue growth of 10.9% over the last two years aligns with its five-year trend, suggesting its demand was predictably strong. 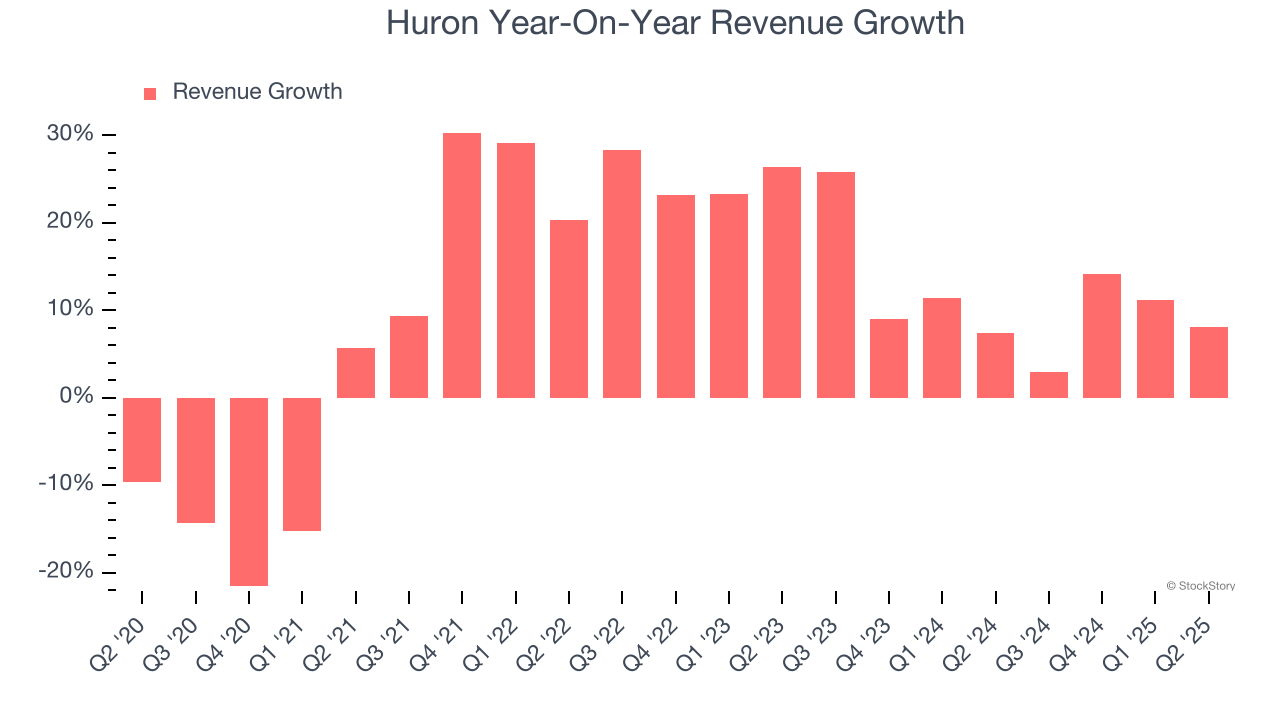
This quarter, Huron’s revenue grew by 8.1% year on year to $411.8 million, missing Wall Street’s estimates.
Looking ahead, sell-side analysts expect revenue to grow 8.6% over the next 12 months, a slight deceleration versus the last two years. Despite the slowdown, this projection is commendable and suggests the market is forecasting success for its products and services.
Today’s young investors won’t have read the timeless lessons in Gorilla Game: Picking Winners In High Technology because it was written more than 20 years ago when Microsoft and Apple were first establishing their supremacy. But if we apply the same principles, then enterprise software stocks leveraging their own generative AI capabilities may well be the Gorillas of the future. So, in that spirit, we are excited to present our Special Free Report on a profitable, fast-growing enterprise software stock that is already riding the automation wave and looking to catch the generative AI next.
Operating Margin
Huron was profitable over the last five years but held back by its large cost base. Its average operating margin of 8.4% was weak for a business services business.
On the plus side, Huron’s operating margin rose by 7.5 percentage points over the last five years, as its sales growth gave it immense operating leverage.
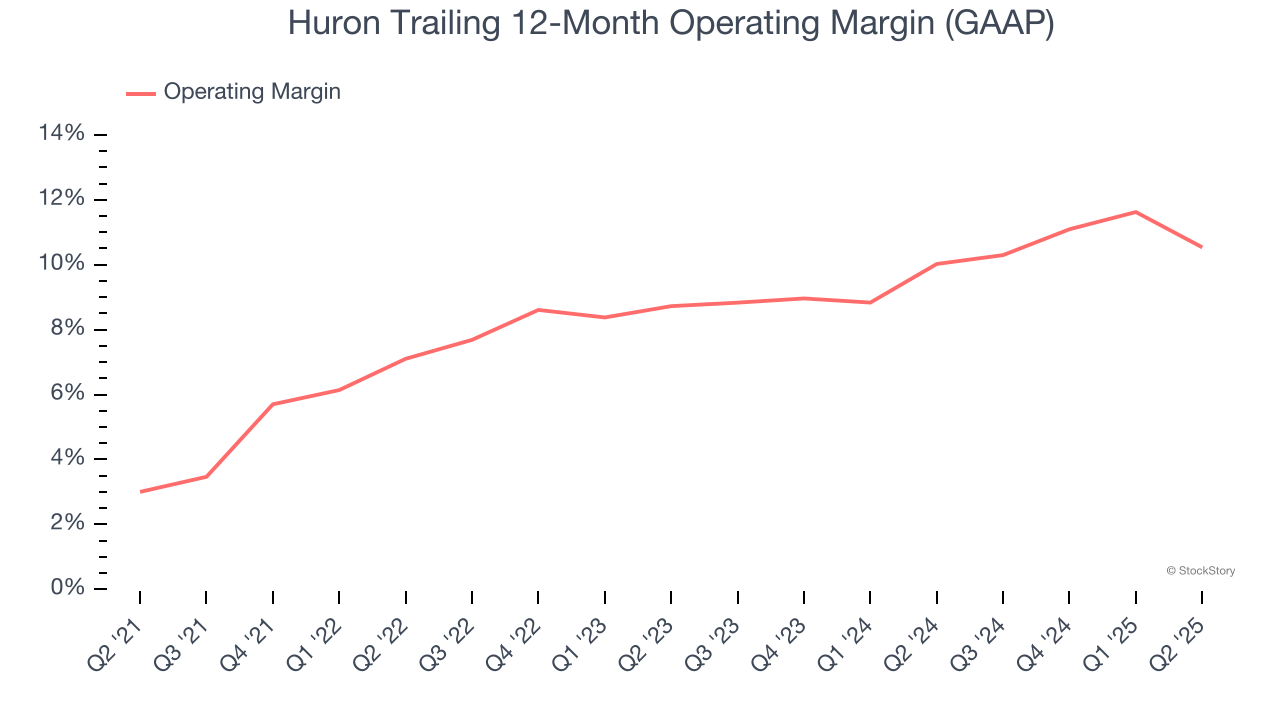
This quarter, Huron generated an operating margin profit margin of 11.1%, down 4.5 percentage points year on year. This contraction shows it was less efficient because its expenses grew faster than its revenue.
Earnings Per Share
Revenue trends explain a company’s historical growth, but the long-term change in earnings per share (EPS) points to the profitability of that growth – for example, a company could inflate its sales through excessive spending on advertising and promotions.
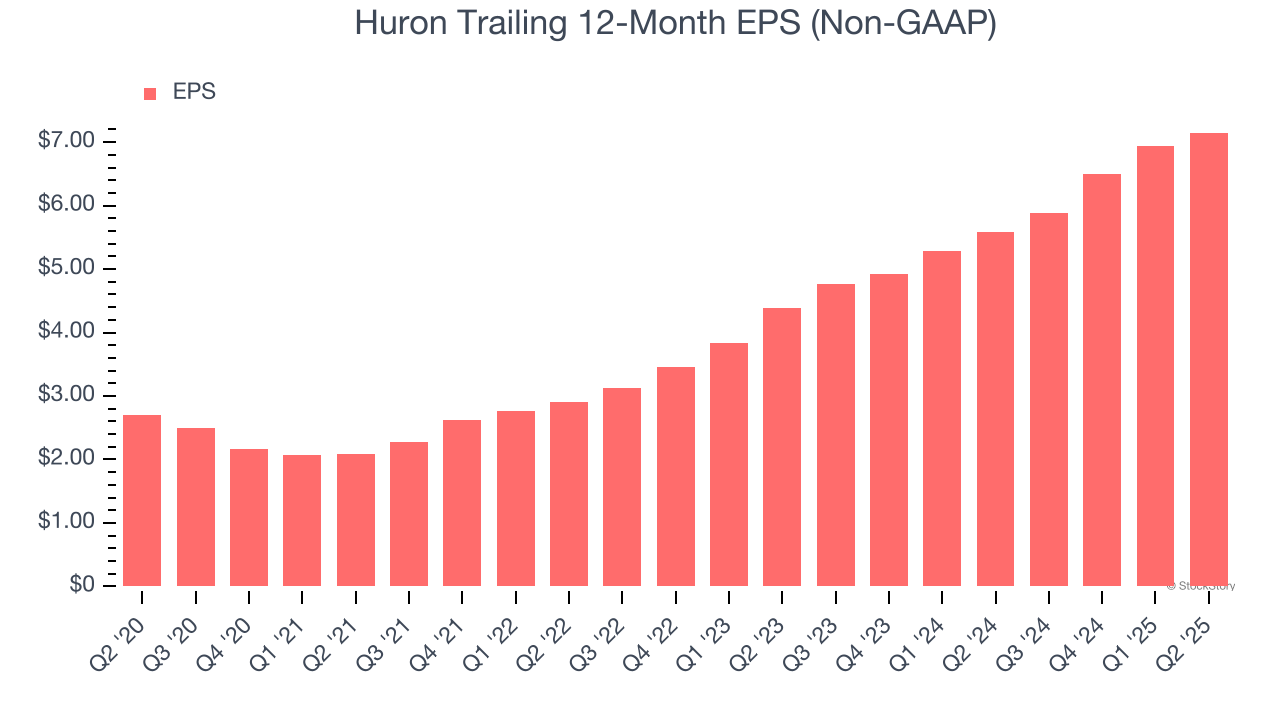
Huron’s EPS grew at an astounding 21.5% compounded annual growth rate over the last five years, higher than its 10.6% annualized revenue growth. This tells us the company became more profitable on a per-share basis as it expanded.
Diving into the nuances of Huron’s earnings can give us a better understanding of its performance. As we mentioned earlier, Huron’s operating margin declined this quarter but expanded by 7.5 percentage points over the last five years. Its share count also shrank by 19.6%, and these factors together are positive signs for shareholders because improving profitability and share buybacks turbocharge EPS growth relative to revenue growth. 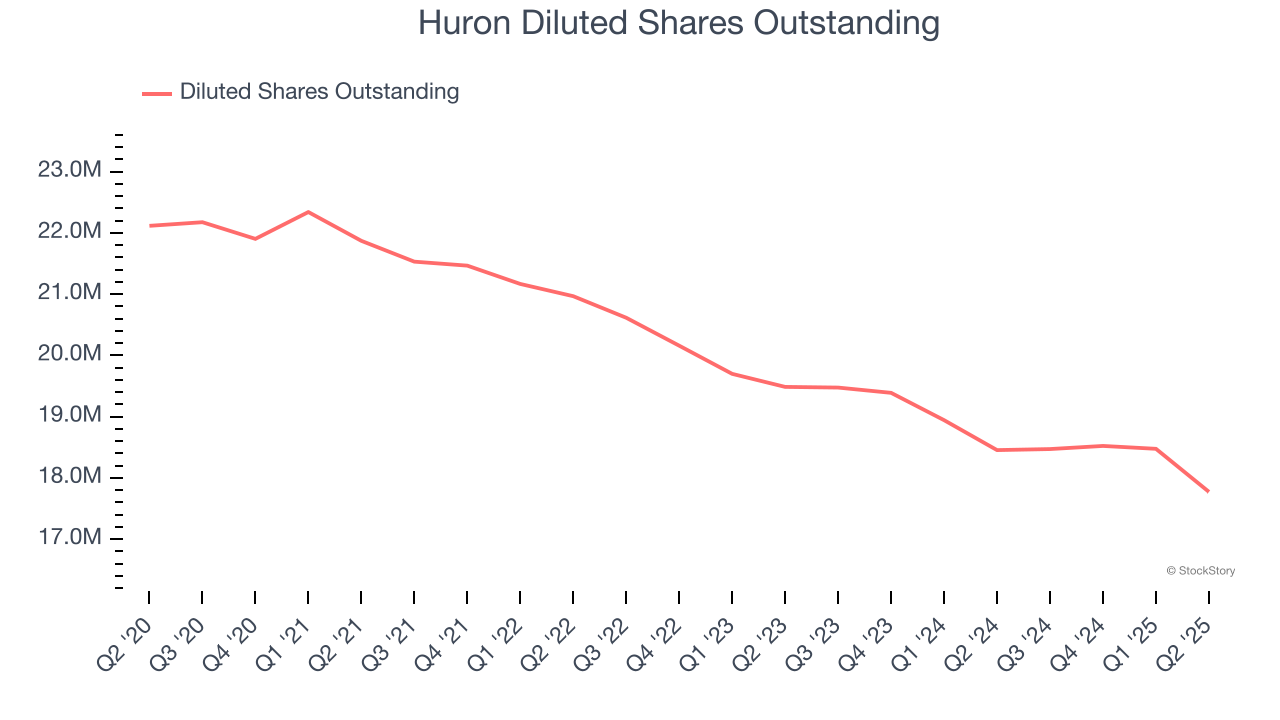
Like with revenue, we analyze EPS over a more recent period because it can provide insight into an emerging theme or development for the business.
For Huron, its two-year annual EPS growth of 27.8% was higher than its five-year trend. We love it when earnings growth accelerates, especially when it accelerates off an already high base.
In Q2, Huron reported adjusted EPS at $1.89, up from $1.68 in the same quarter last year. This print beat analysts’ estimates by 5.4%. Over the next 12 months, Wall Street expects Huron’s full-year EPS of $7.15 to grow 7.5%.
Key Takeaways from Huron’s Q2 Results
It was encouraging to see Huron’s full-year revenue guidance beat analysts’ expectations. We were also happy its EPS outperformed Wall Street’s estimates. On the other hand, its revenue slightly missed. Overall, this print had some key positives. The stock traded up 5.8% to $140 immediately following the results.
Sure, Huron had a solid quarter, but if we look at the bigger picture, is this stock a buy? When making that decision, it’s important to consider its valuation, business qualities, as well as what has happened in the latest quarter. We cover that in our actionable full research report which you can read here, it’s free.