
Since July 2020, the S&P 500 has delivered a total return of 99.3%. But one standout stock has more than doubled the market - over the past five years, Cintas has surged 224% to $218.87 per share. Its momentum hasn’t stopped as it’s also gained 16% in the last six months thanks to its solid quarterly results, beating the S&P by 9.7%.
Is it too late to buy CTAS? Find out in our full research report, it’s free.
Why Are We Positive On CTAS?
Starting as a family business collecting and cleaning shop rags in Cincinnati, Cintas (NASDAQ: CTAS) provides corporate identity uniforms, facility services, and safety products to over one million businesses across North America.
1. Long-Term Revenue Growth Shows Momentum
Examining a company’s long-term performance can provide clues about its quality. Any business can put up a good quarter or two, but many enduring ones grow for years. Over the last five years, Cintas grew its sales at a decent 6.9% compounded annual growth rate. Its growth was slightly above the average business services company and shows its offerings resonate with customers. 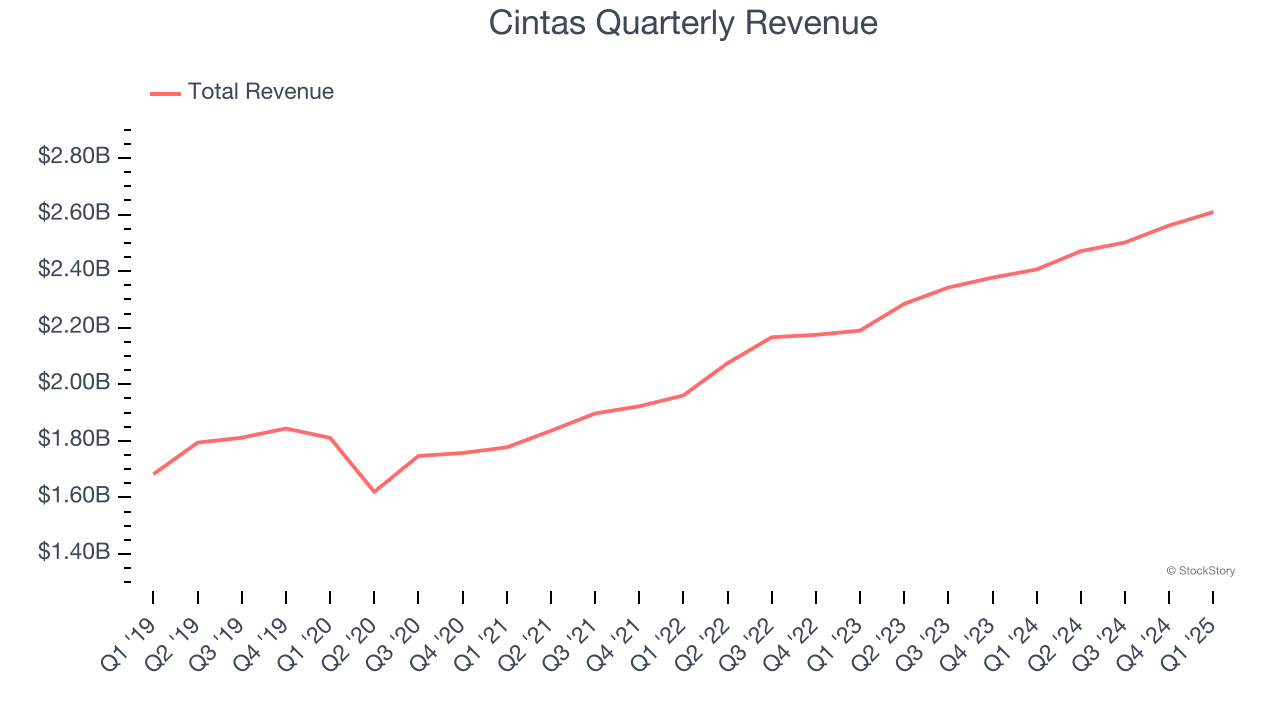
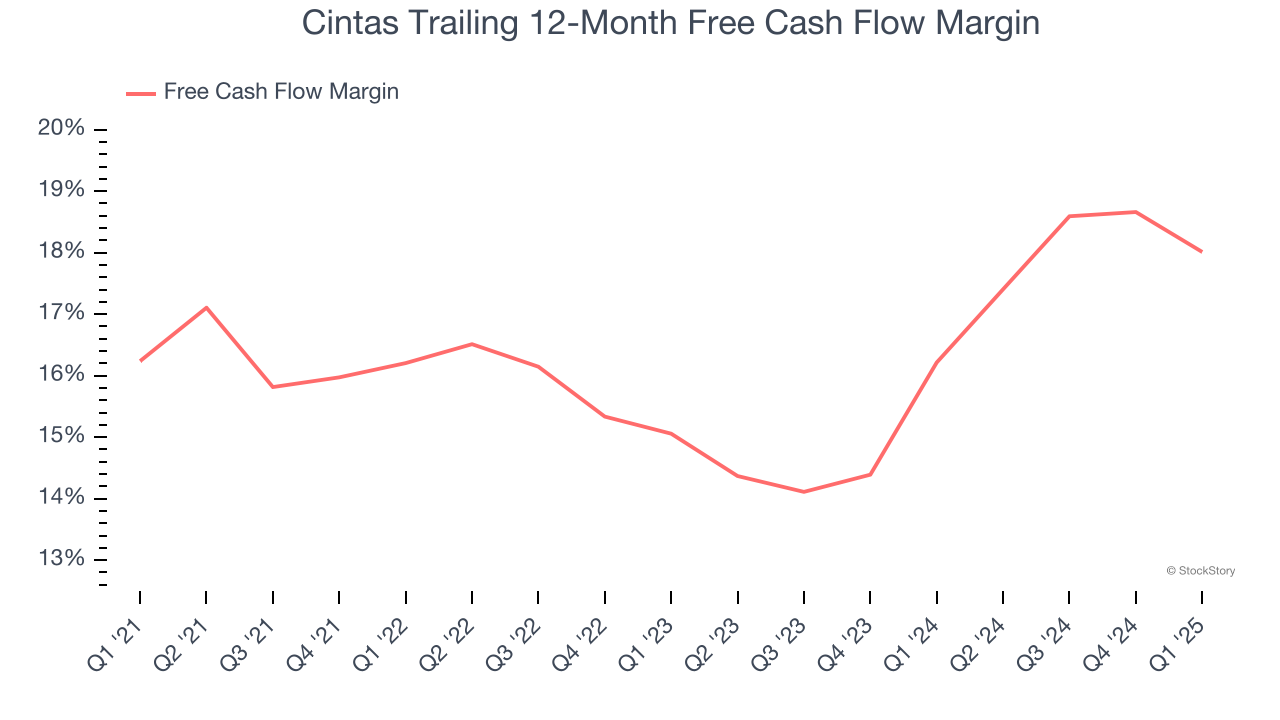
2. Excellent Free Cash Flow Margin Boosts Reinvestment Potential
If you’ve followed StockStory for a while, you know we emphasize free cash flow. Why, you ask? We believe that in the end, cash is king, and you can’t use accounting profits to pay the bills.
Cintas has shown terrific cash profitability, enabling it to reinvest, return capital to investors, and stay ahead of the competition while maintaining an ample cushion. The company’s free cash flow margin was among the best in the business services sector, averaging 16.4% over the last five years.
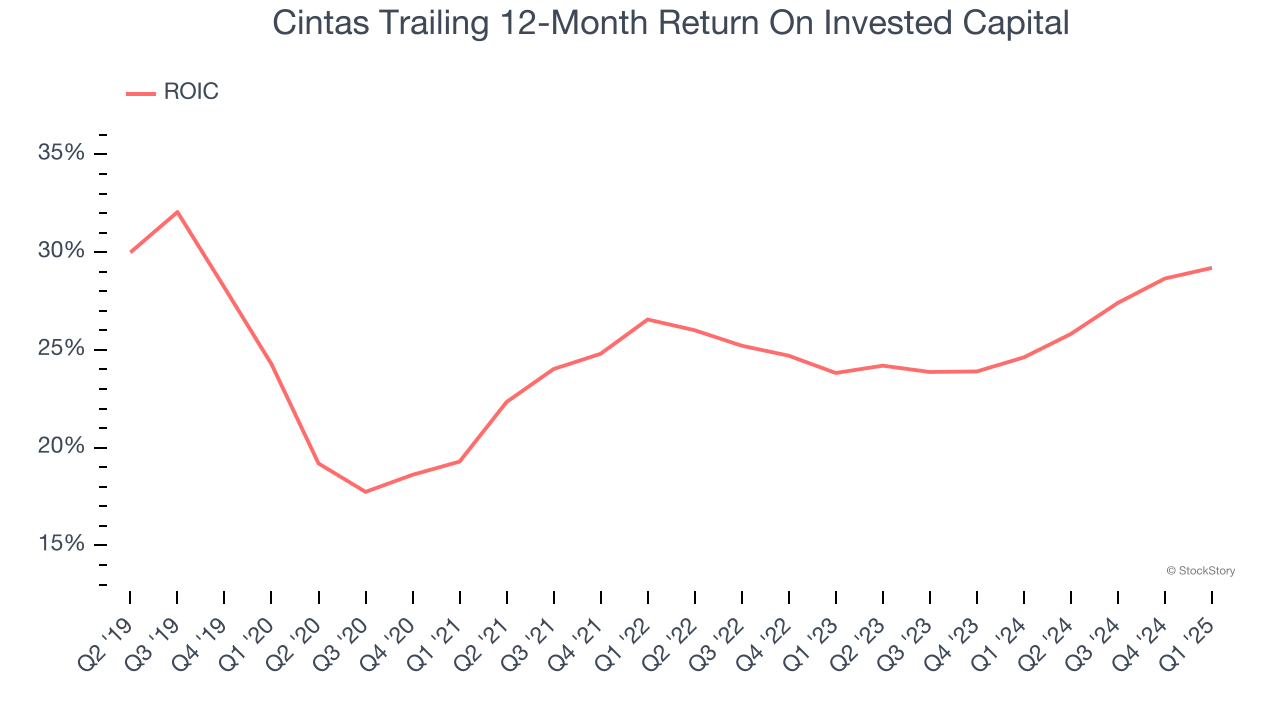
3. Stellar ROIC Showcases Lucrative Growth Opportunities
Growth gives us insight into a company’s long-term potential, but how capital-efficient was that growth? A company’s ROIC explains this by showing how much operating profit it makes compared to the money it has raised (debt and equity).
Cintas’s five-year average ROIC was 24.7%, placing it among the best business services companies. This illustrates its management team’s ability to invest in highly profitable ventures and produce tangible results for shareholders.
Final Judgment
These are just a few reasons Cintas is a rock-solid business worth owning, and with its shares beating the market recently, the stock trades at 47.1× forward P/E (or $218.87 per share). Is now a good time to buy? See for yourself in our full research report, it’s free.
Stocks We Like Even More Than Cintas
The market surged in 2024 and reached record highs after Donald Trump’s presidential victory in November, but questions about new economic policies are adding much uncertainty for 2025.
While the crowd speculates what might happen next, we’re homing in on the companies that can succeed regardless of the political or macroeconomic environment. Put yourself in the driver’s seat and build a durable portfolio by checking out our Top 5 Strong Momentum Stocks for this week. This is a curated list of our High Quality stocks that have generated a market-beating return of 183% over the last five years (as of March 31st 2025).
Stocks that made our list in 2020 include now familiar names such as Nvidia (+1,545% between March 2020 and March 2025) as well as under-the-radar businesses like the once-small-cap company Comfort Systems (+782% five-year return). Find your next big winner with StockStory today.


