Let’s dig into the relative performance of Gorman-Rupp (NYSE: GRC) and its peers as we unravel the now-completed Q1 gas and liquid handling earnings season.
Gas and liquid handling companies possess the technical know-how and specialized equipment to handle valuable (and sometimes dangerous) substances. Lately, water conservation and carbon capture–which requires hydrogen and other gasses as well as specialized infrastructure–have been trending up, creating new demand for products such as filters, pumps, and valves. On the other hand, gas and liquid handling companies are at the whim of economic cycles. Consumer spending and interest rates, for example, can greatly impact the industrial production that drives demand for these companies’ offerings.
The 12 gas and liquid handling stocks we track reported a strong Q1. As a group, revenues beat analysts’ consensus estimates by 0.8% while next quarter’s revenue guidance was in line.
Luckily, gas and liquid handling stocks have performed well with share prices up 17.9% on average since the latest earnings results.
Gorman-Rupp (NYSE: GRC)
Powering fluid dynamics since 1934, Gorman-Rupp (NYSE: GRC) has evolved from its Ohio origins into a global manufacturer and seller of pumps and pump systems.
Gorman-Rupp reported revenues of $163.9 million, up 2.9% year on year. This print fell short of analysts’ expectations by 0.5%, but it was still a satisfactory quarter for the company with an impressive beat of analysts’ EBITDA estimates.
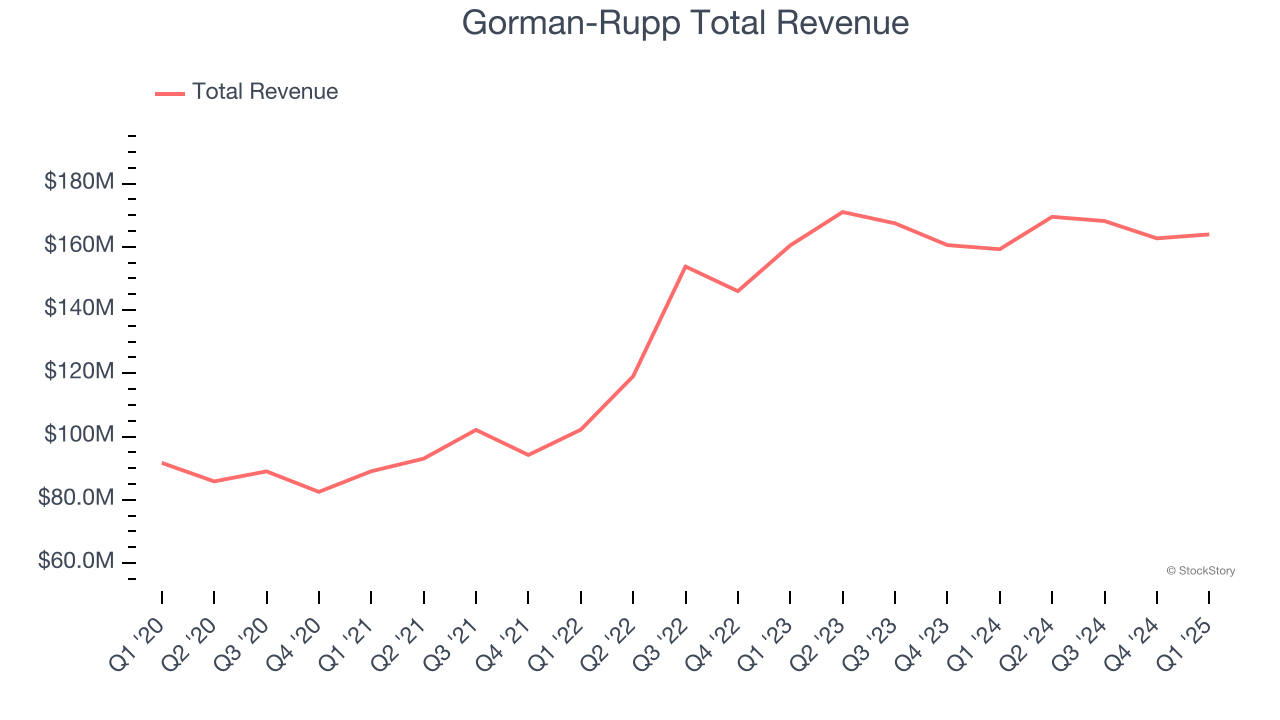
Interestingly, the stock is up 16.3% since reporting and currently trades at $38.75.
Is now the time to buy Gorman-Rupp? Access our full analysis of the earnings results here, it’s free.
Best Q1: Helios (NYSE: HLIO)
Founded on the principle of treating others as one wants to be treated, Helios (NYSE: HLIO) designs, manufactures, and sells motion and electronic control components for various sectors.
Helios reported revenues of $195.5 million, down 7.8% year on year, outperforming analysts’ expectations by 3.8%. The business had an exceptional quarter with a solid beat of analysts’ organic revenue and EBITDA estimates.
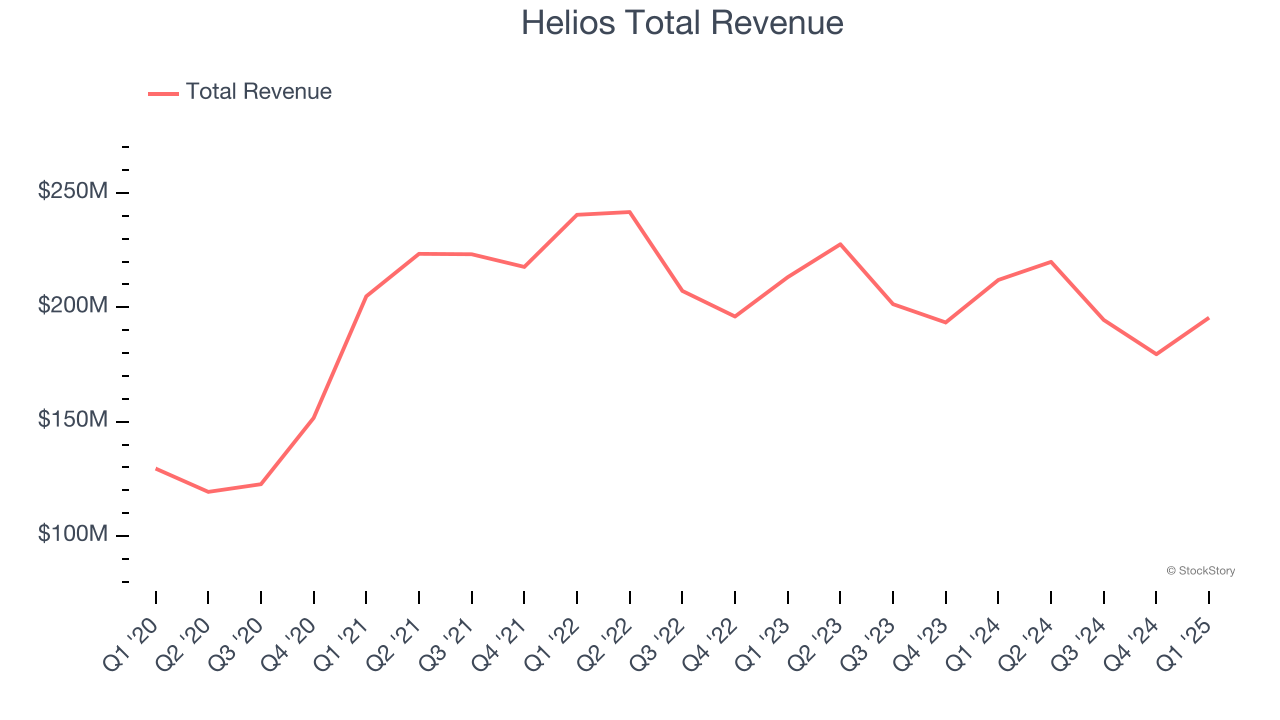
Helios pulled off the biggest analyst estimates beat among its peers. The market seems happy with the results as the stock is up 32.9% since reporting. It currently trades at $36.03.
Is now the time to buy Helios? Access our full analysis of the earnings results here, it’s free.
Slowest Q1: Parker-Hannifin (NYSE: PH)
Founded in 1917, Parker Hannifin (NYSE: PH) is a manufacturer of motion and control systems for a wide variety of mobile, industrial and aerospace markets.
Parker-Hannifin reported revenues of $4.96 billion, down 2.2% year on year, in line with analysts’ expectations. It was a slower quarter as it posted a significant miss of analysts’ adjusted operating income and organic revenue estimates.
Interestingly, the stock is up 19.1% since the results and currently trades at $719.15.
Read our full analysis of Parker-Hannifin’s results here.
Chart (NYSE: GTLS)
Installing the first bulk Co2 tank for McDonalds’s sodas, Chart (NYSE: GTLS) provides equipment to store and transport gasses.
Chart reported revenues of $1.00 billion, up 5.3% year on year. This number was in line with analysts’ expectations. It was a very strong quarter as it also recorded a solid beat of analysts’ adjusted operating income estimates and full-year EBITDA guidance exceeding analysts’ expectations.
Chart had the weakest full-year guidance update among its peers. The stock is up 28.8% since reporting and currently trades at $173.63.
Read our full, actionable report on Chart here, it’s free.
ITT (NYSE: ITT)
Playing a crucial role in the development of the first transatlantic television transmission in 1956, ITT (NYSE: ITT) provides motion and fluid handling equipment for various industries
ITT reported revenues of $913 million, flat year on year. This result surpassed analysts’ expectations by 0.6%. More broadly, it was a mixed quarter as it also recorded a decent beat of analysts’ EBITDA estimates but full-year EPS guidance meeting analysts’ expectations.
The stock is up 17.5% since reporting and currently trades at $161.13.
Read our full, actionable report on ITT here, it’s free.
Market Update
The Fed’s interest rate hikes throughout 2022 and 2023 have successfully cooled post-pandemic inflation, bringing it closer to the 2% target. Inflationary pressures have eased without tipping the economy into a recession, suggesting a soft landing. This stability, paired with recent rate cuts (0.5% in September 2024 and 0.25% in November 2024), fueled a strong year for the stock market in 2024. The markets surged further after Donald Trump’s presidential victory in November, with major indices reaching record highs in the days following the election. Still, questions remain about the direction of economic policy, as potential tariffs and corporate tax changes add uncertainty for 2025.
Want to invest in winners with rock-solid fundamentals? Check out our Top 5 Quality Compounder Stocks and add them to your watchlist. These companies are poised for growth regardless of the political or macroeconomic climate.