Over the past six months, Williams-Sonoma’s stock price fell to $185.20. Shareholders have lost 9.4% of their capital, which is disappointing considering the S&P 500 has climbed by 5.7%. This may have investors wondering how to approach the situation.
Is there a buying opportunity in Williams-Sonoma, or does it present a risk to your portfolio? Get the full stock story straight from our expert analysts, it’s free.
Why Is Williams-Sonoma Not Exciting?
Even with the cheaper entry price, we're cautious about Williams-Sonoma. Here are three reasons why WSM doesn't excite us and a stock we'd rather own.
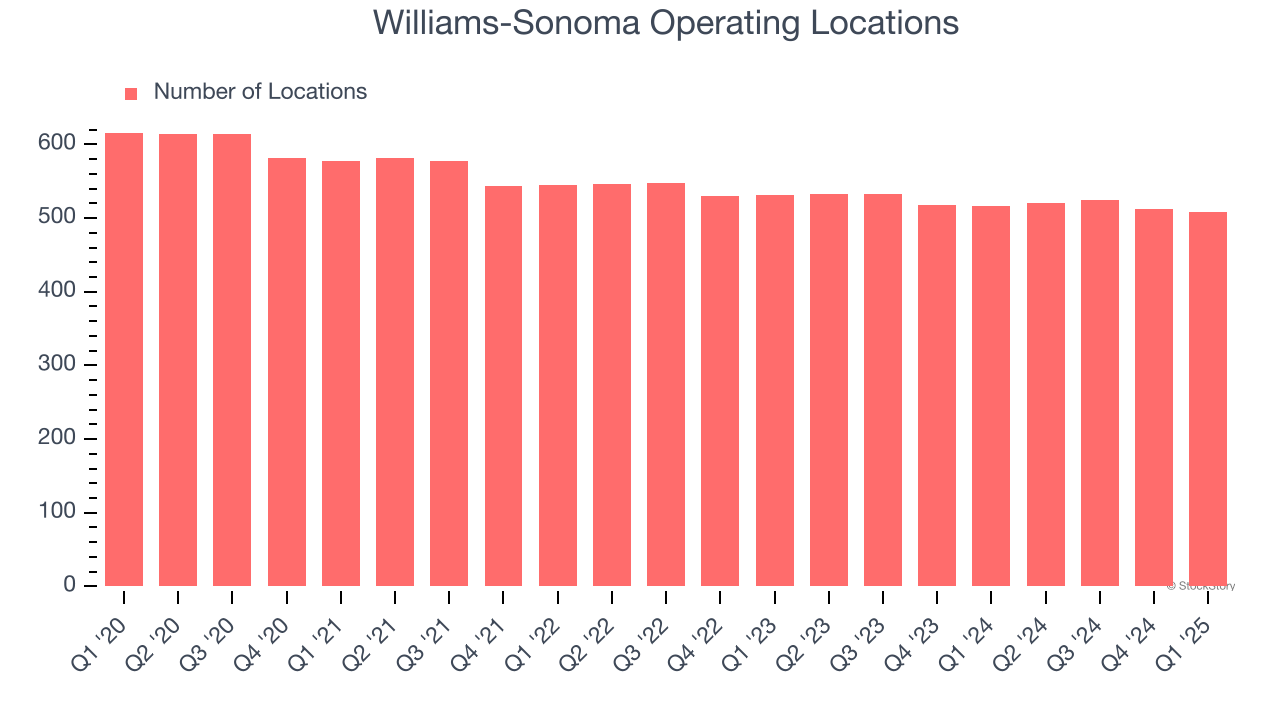
1. Stores Are Closing, a Headwind for Revenue
A retailer’s store count influences how much it can sell and how quickly revenue can grow.
Williams-Sonoma operated 508 locations in the latest quarter. Over the last two years, the company has generally closed its stores, averaging 2.1% annual declines.
When a retailer shutters stores, it usually means that brick-and-mortar demand is less than supply, and it is responding by closing underperforming locations to improve profitability.
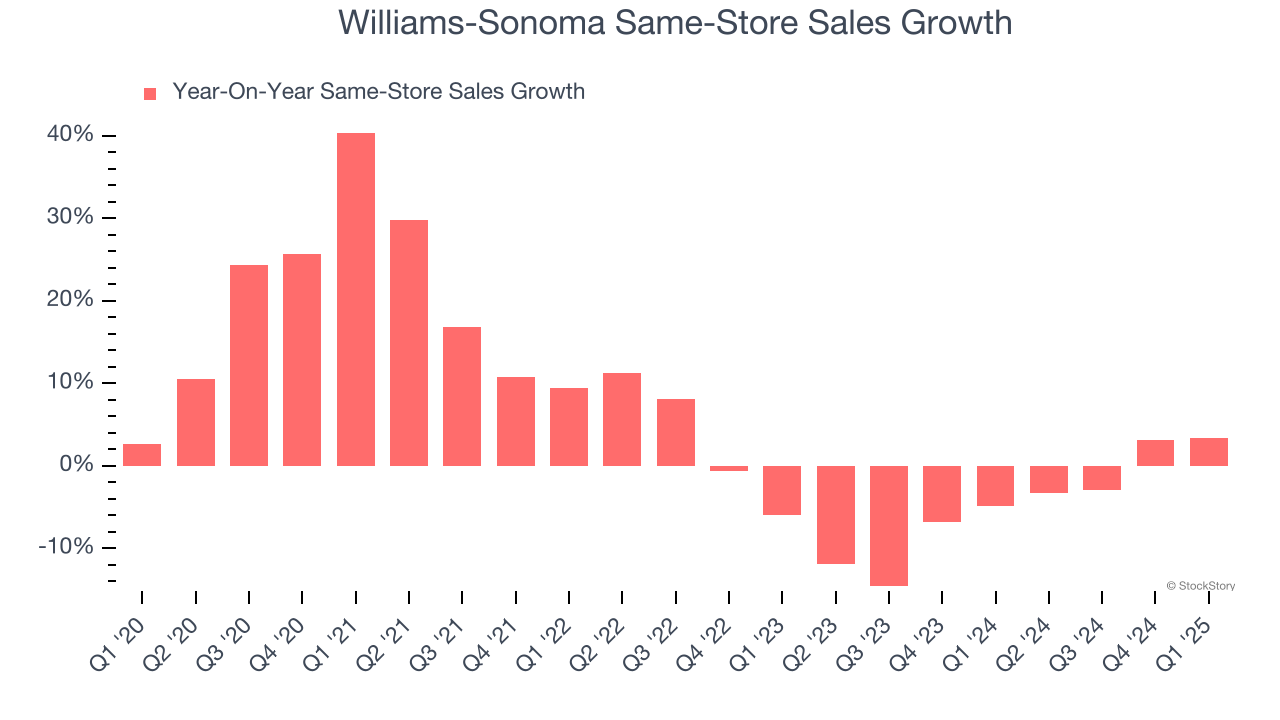
2. Shrinking Same-Store Sales Indicate Waning Demand
Same-store sales show the change in sales for a retailer's e-commerce platform and brick-and-mortar shops that have existed for at least a year. This is a key performance indicator because it measures organic growth.
Williams-Sonoma’s demand has been shrinking over the last two years as its same-store sales have averaged 4.7% annual declines.
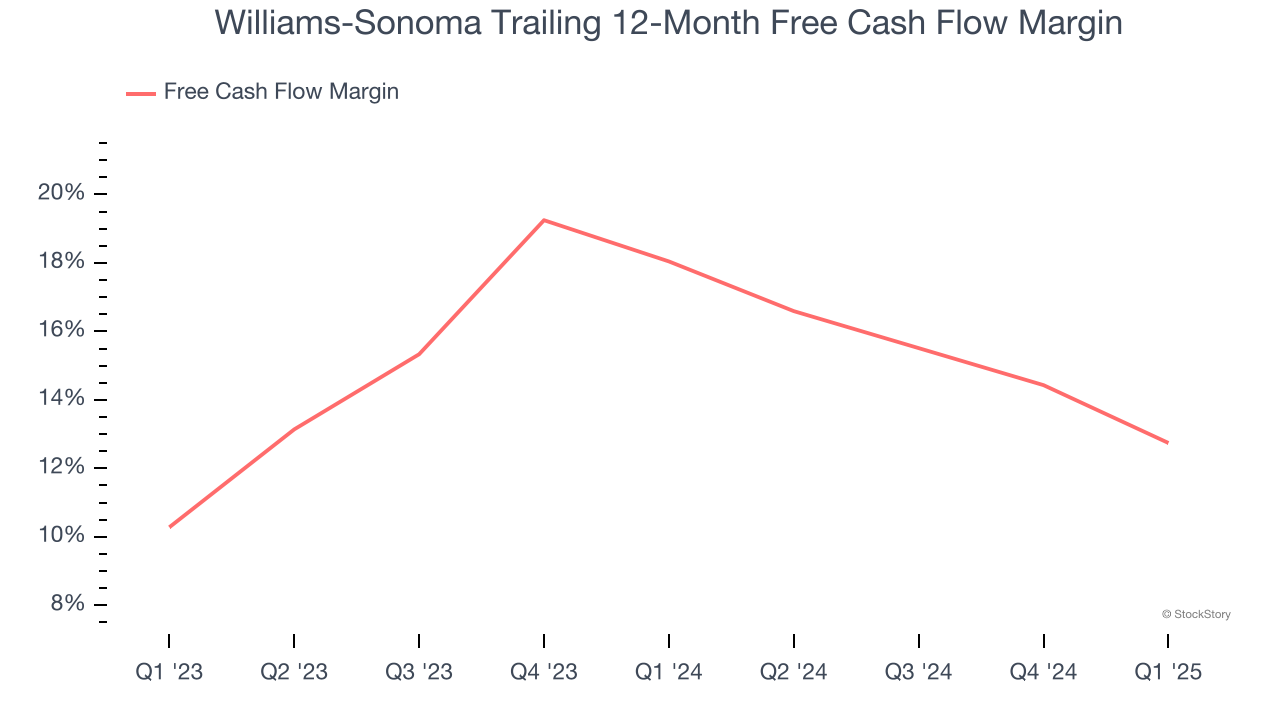
3. Free Cash Flow Margin Dropping
Free cash flow isn't a prominently featured metric in company financials and earnings releases, but we think it's telling because it accounts for all operating and capital expenses, making it tough to manipulate. Cash is king.
As you can see below, Williams-Sonoma’s margin dropped by 5.3 percentage points over the last year. This decrease warrants extra caution because Williams-Sonoma failed to grow its same-store sales. Its cash profitability could decay further if it tries to reignite growth by opening new stores.
Final Judgment
Williams-Sonoma’s business quality ultimately falls short of our standards. Following the recent decline, the stock trades at 21.9× forward P/E (or $185.20 per share). This multiple tells us a lot of good news is priced in - we think other companies feature superior fundamentals at the moment. Let us point you toward the Amazon and PayPal of Latin America.
High-Quality Stocks for All Market Conditions
Trump’s April 2024 tariff bombshell triggered a massive market selloff, but stocks have since staged an impressive recovery, leaving those who panic sold on the sidelines.
Take advantage of the rebound by checking out our Top 5 Strong Momentum Stocks for this week. This is a curated list of our High Quality stocks that have generated a market-beating return of 183% over the last five years (as of March 31st 2025).
Stocks that made our list in 2020 include now familiar names such as Nvidia (+1,545% between March 2020 and March 2025) as well as under-the-radar businesses like the once-small-cap company Exlservice (+354% five-year return). Find your next big winner with StockStory today.
StockStory is growing and hiring equity analyst and marketing roles. Are you a 0 to 1 builder passionate about the markets and AI? See the open roles here.